


A cup and handle pattern is slowly taking shape on the Shiba Inu chart, and the same could have drastic implications on its price. Although the technical pattern pertains to a higher price, investors would have to wait out the second correctional phase before a breakout.
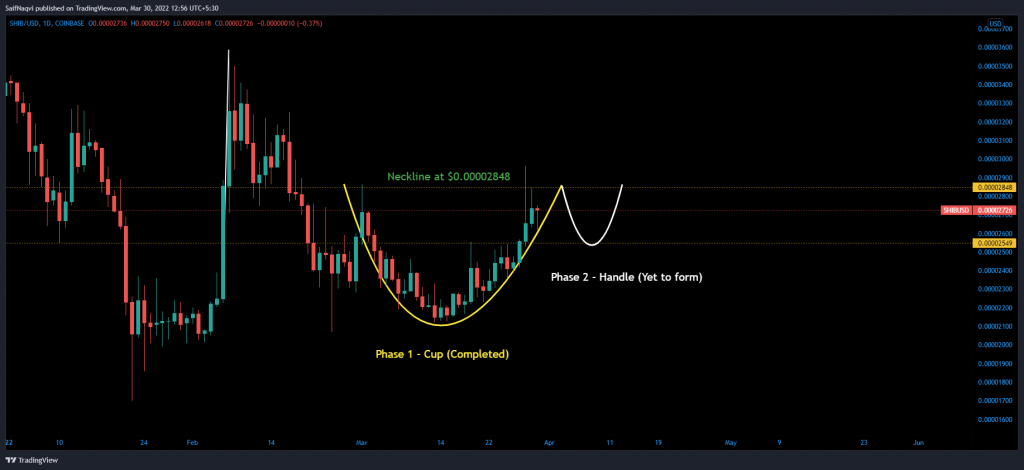
Price-wise, Shiba Inu has had a topsy-turvy March. During the first half of the month, SHIB declined steadily from $0.00002963 and hit a near 1-month low at $0.00002129. The latter half marked recovery, with SHIB regaining momentum and revisiting its earlier high. Interestingly, a trendline plotted across these highs and lows suggested that an early ‘cup and handle pattern was in formation.
In technical terms, a cup and handle is a bullish development that leads to higher prices. The pattern contains three elements – the cup, handle, and neckline (resistance). Normally, the neckline triggers a minor correction which, in turn, shapes the handle. Now, since SHIB’s handle was yet to form, the next logical phase was the said minor correction.
Bulls Losing Momentum?
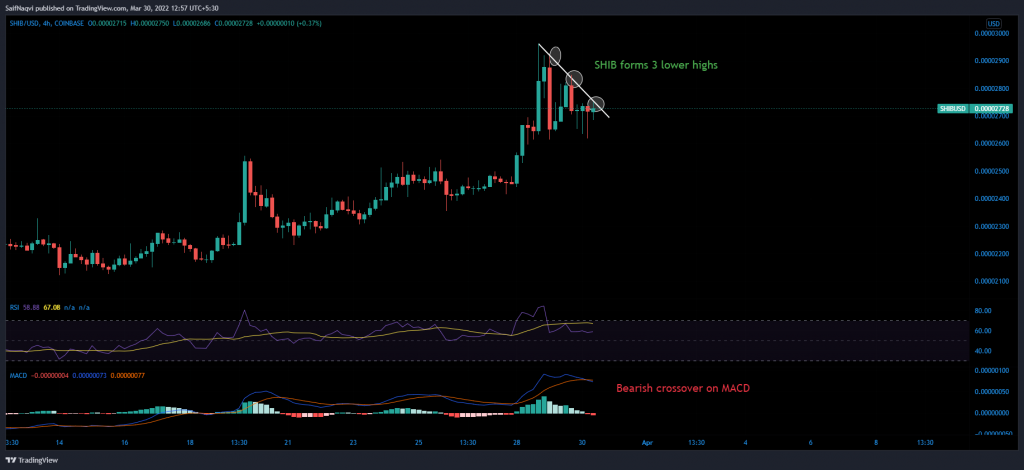
Tuning in on the 4-hour chart showed that bulls were already losing near-term market control. Three lower highs were formed over the past couple of days and the MACD and RSI were starting to favor sellers.
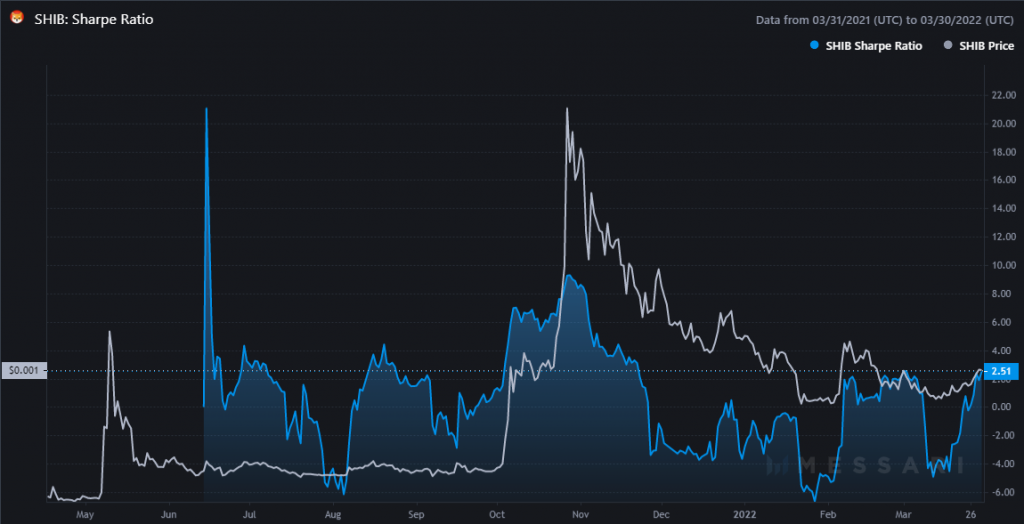
Furthermore, SHIB’s Sharpe Ratio was also trading at extreme levels. In 2022, this ratio has climbed above 2 only on three occasions, and each time, a correction has followed. The Sharpe Ratio helps determines the risk involved with holding a particular investment. Although a higher value indicates greater returns, it can sometimes lead to profit-booking.
Shiba Inu Direction
If a price decline does follow suit, investors can keep an eye out for near-term supports of $0.00002560 and $0.00002427. However, keep in mind that according to the pattern, the price would eventually break above the $0.00002848 resistance once the correction runs its course.
At the time of writing, SHIB traded at $0.00002728, down by 1.6% over the last 24 hours.