


Charting patterns have existed since the early days of stock market trading. They are part of technical analysis, which involves studying the rising and falling trends printed out by price action. Some of the best places to practice charting patterns is Trading View
What are Charting Patterns?
A pattern naturally forms because of the movement of prices of the different assets being traded. It is the basis for technical analysis. Whether in cryptocurrencies, stocks, or forex, every trader must learn basic charting patterns if they hope to profit from the markets. Here are some basic charting patterns simplified.
1. Head and Shoulders Pattern
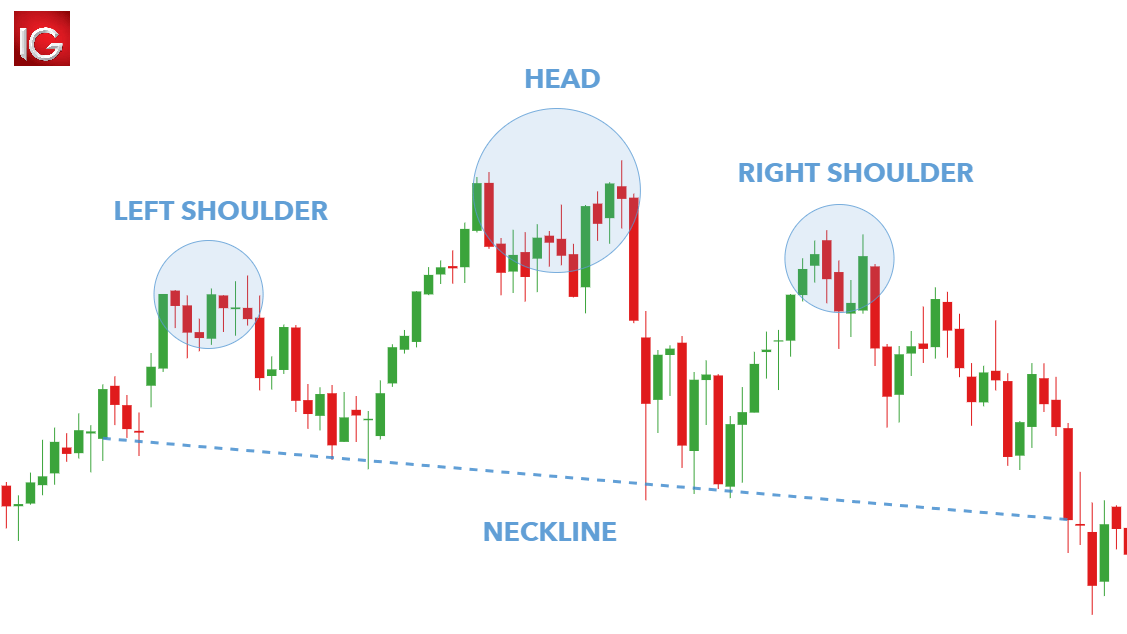
The head-and-shoulders pattern commonly indicates a bearish reversal pattern that shows when a specific trend has changed. The pattern consists of three peaks with a neckline that should be evident between the two shoulders. This neckline acts as a key support level and helps to identify a breakdown.
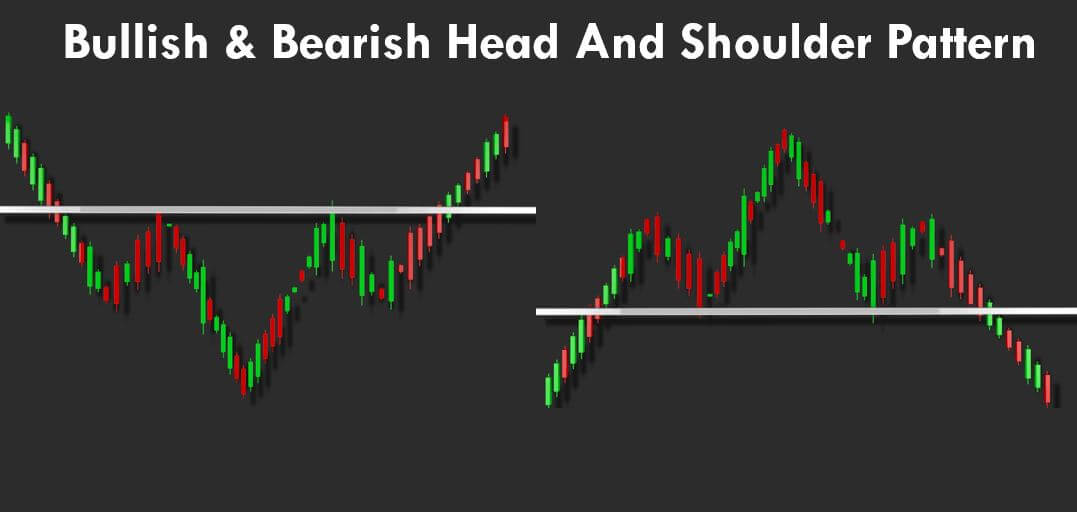
If prices fall below the neckline, it means the head-and-shoulders pattern has completed its formation and is now in danger of breaking. The head-and-shoulders pattern is a strong confirmation of the daily or intraday 4-hour charts. It provides more conviction than the smaller time frames. The opposite of this set up is the inverted head-and-shoulder pattern.
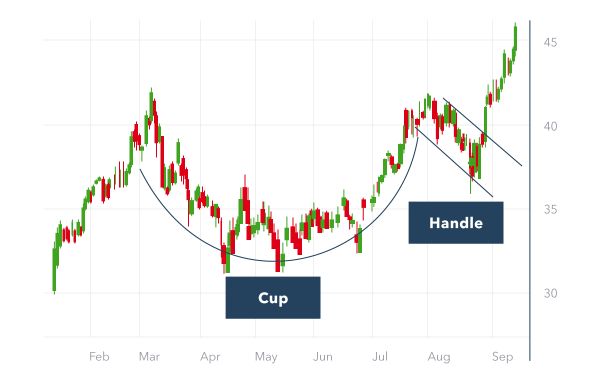
2. The Cup-with-Handle Pattern
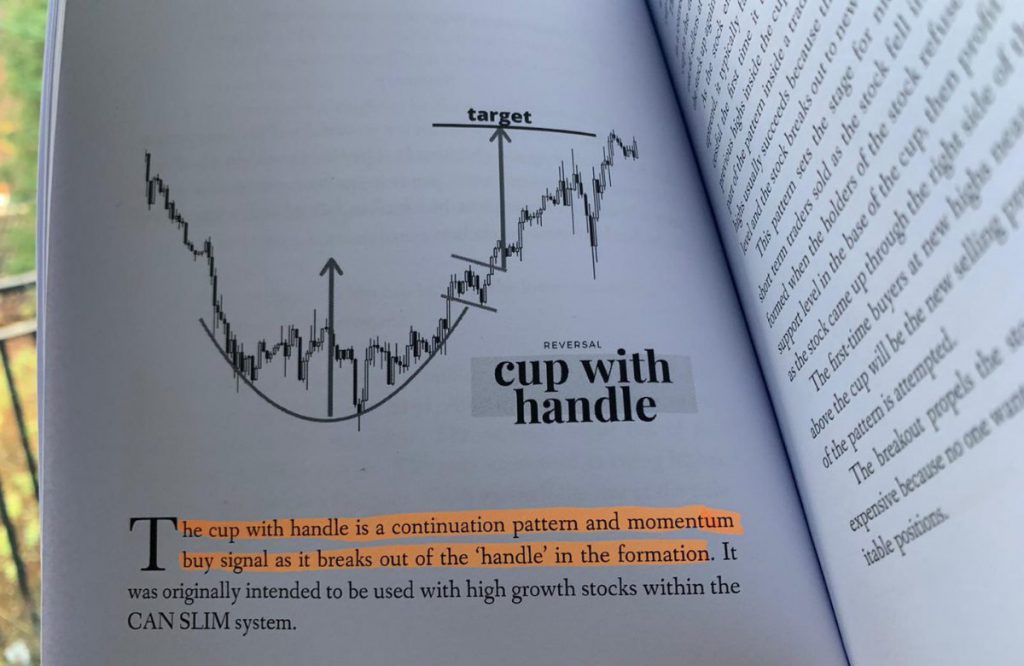
The cup-with-handle pattern formation is a bullish continuation pattern that forms the basis of a half-round cup. The handle should have a bull flag formation pattern to be legitimate. It should represent the current trend’s direction. The handle should then break out from the bottom. Cup-and-handle patterns are not common, and they are best identified on the Daily chart.
3. The Double-Top & Bottom Patterns
The double-top pattern is a popular chart pattern that helps traders to determine a change in a trend. It occurs when the price tries to test a particular resistance level before going sideways for a while. Double tops can be clearly visible on the daily or weekly charts, depending on the time frame. They are also confirmed on the higher intraday charts.
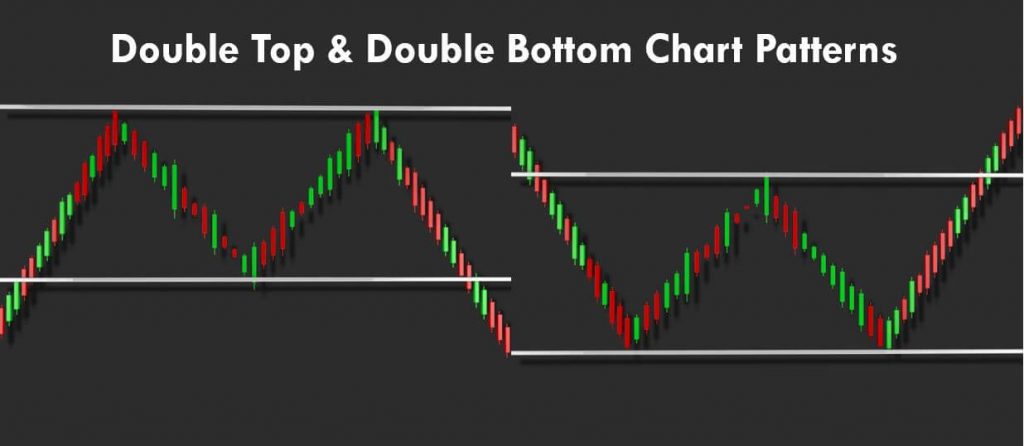
The opposite of a double top pattern is a double-bottom pattern. A double bottom chart pattern occurs when the asset price drops below a certain level of support. It then rises to a level of resistance before dropping again. It is a sign of a bullish reversal and the end of the downtrend.
4. Bullish & Bearish Flag Patterns
A flag is a price pattern that shows a short-term price trend in a shorter time frame. It’s similar to the concept of a flagpole, which tells the viewer about the direction of a flag.
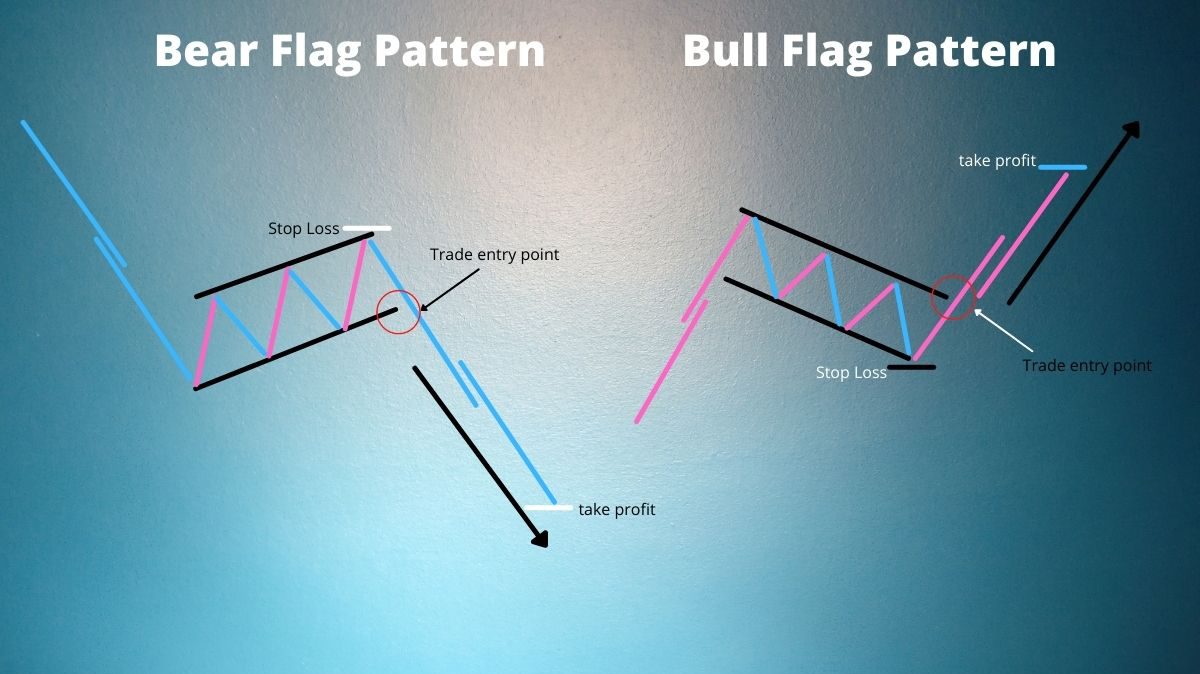
The flag pattern is an indication of a potential continuation of a previous trend. A price increase could be rapid enough to trigger a trade. A bearish flag is actually an inverted bullish flag.
5. Wedges
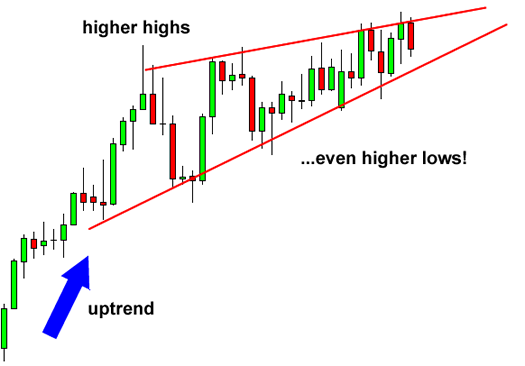
A wedge is a trend-line pattern that shows how an asset’s price moves between two sloping trend lines. The trend line is usually steeper than the resistance line. There are two types of wedges: Rising and Falling wedges. The rising wedge shows that the price of an asset will eventually decline permanently if it breaks through a support level. On the other hand, the falling wedge indicates the price of an asset will eventually increase permanently.