Over the last 24 hours, Solana has seen an ongoing bearish sentiment magnify, threatening SOL’s $200 potential for May. In the last day, the asset has fallen more than 5% according to CoinMarketCap. Those losses extend over the last 30 days, where it has fallen more than 27%.
Currently, SOL is trading at $135 and worrying many investors who observe its most recent performances. However, there still remain some technical indicators that leave those traders hopeful for its eventual turnaround. So, let’s explore how hope could remain for an impending Solana rally.
Solana Fall Continues

Also Read: Solana: One Trader Earns $23M Through BONK, WIF Meme Coins
As we’ve stated, Solana has not had the greatest 30 days. However, that has only magnified in the last day. Throughout the previous 24 hours, the asset has fallen as much as 6%, further strengthening concern regarding its performance.
The metrics are not favorable, with its market cap also dipping by more than 4% over the last day. Yet, the asset has still been able to maintain an overall market value above $60 billion. But could these declines in the short-term be hiding what a more optimistic overarching journey for Solana is?


Also Read: Solana (SOL) Price Prediction: May 2024
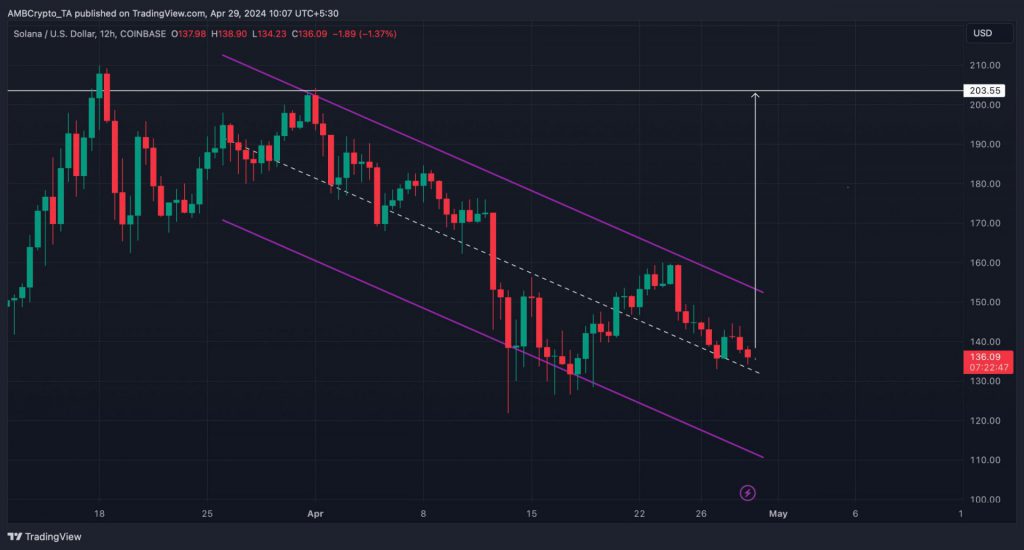
On SOL’s 12-hour price chart, the asset appears to be moving in a descending channel. This showcases a much deeper story than the surface-level price reactions for Solana. Specifically, it provides a clear path out of the downturn.
Solana will need to test the pattern, and then proceed to breakout. From there, a bullish sentiment should begin to form. Subsequently, the incoming weeks could provide a much different story as far as SOL’s trajectory is concerned.
Moreover, they could point Solana towards the $200 price point in the next month.
Could SOL Hit $200 in May?


Also Read: Solana (SOL) Falls Below $150, But a Rally May Still Be Forming
When it comes to Solana’s potential rally, whether or not SOL hits $200 in May relies on a lot of speculation and prediction. However, the data paints an interesting picture regarding the short-term price reaction for the asset.
When the price of SOL fell over the last 24 hours, its volume also noted a stark decline. This is important for what it means for its impending performance. Specifically, it speaks of a bearish trend nearing its end.
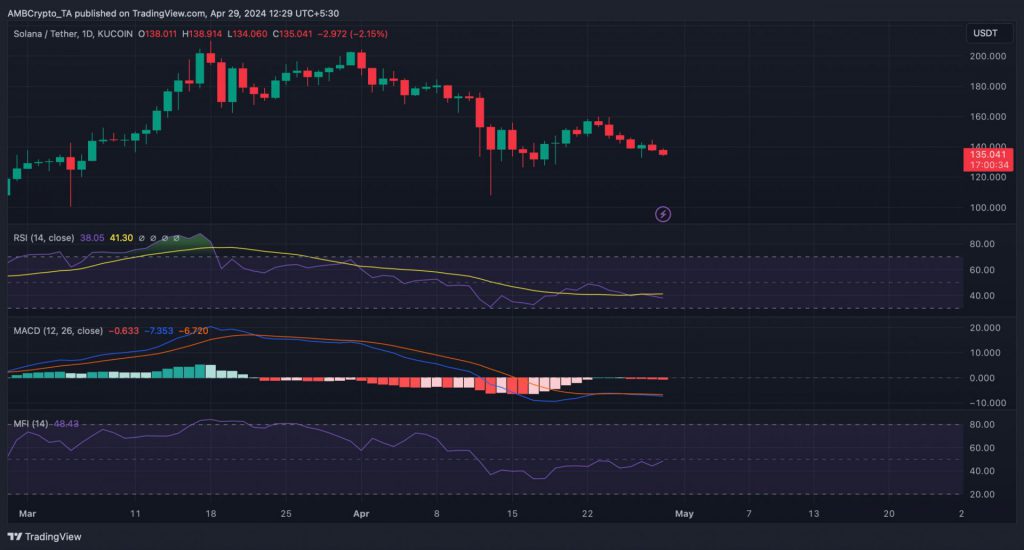
Data observation from AMBCrypto notes that open interest had declined alongside the volume, further signaling a price reversal. However, that fact is met with its Funding Rate being rather high, and its Relative Strength Index (RSI) decreasing. Both of those indicate that a bearish trend could continue.


Also Read: Solana: WIF & BONK Meme Coins Surge as SOL Surges 10%
However, data shows that SOL’s liquidity would increase to almost $146 if a bull rally began to take place. Therefore, if the asset could ascend above that, a sustained bull rally would be in play. From there, $160 would be the next critical price point for SOL to reach.
Success there would indicate a full breakout to $200 would be possible for Solana. Moreover, those developments taking place could be near if overall market sentiment returns to a positive place. May will be interesting, as the asset’s performance could be set to surge.


