


Metaverse platform The Sandbox has showcased strong developmental activity throughout February. Collaborations with Gucci and Snoop Dogg were the biggest highlight of the month. Yet, the developments have not resulted in consistent gains on the chart, with SAND’s value down by 24% in the month.
However, the same could very well change heading into March. The price was trading at critical support, bolstered by the daily 200-SMA (green). SAND traded at $2.90, down by 5.6% over the last 24 hours at the time of writing.
The Sandbox Daily Chart
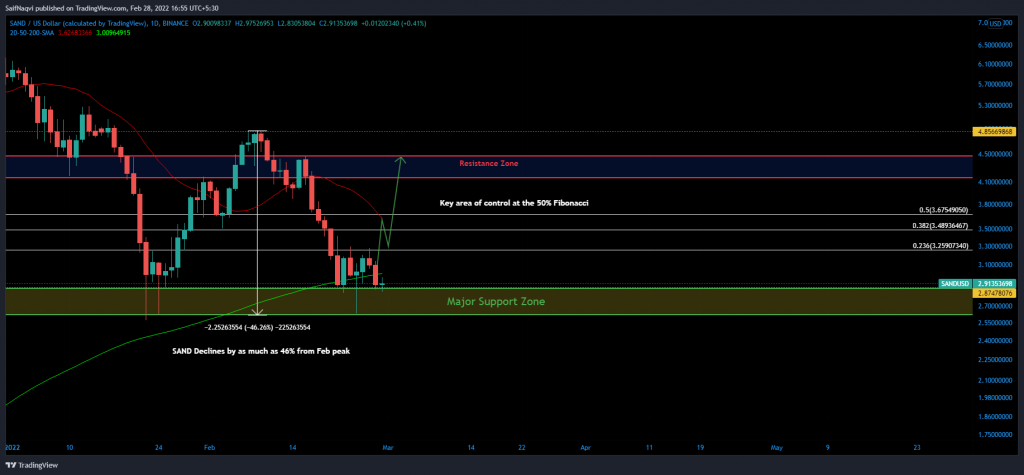
The Sandbox’s price was marred by constant trading outflows since the second week of February but bulls held strong at a demand zone between $2.60-$2.90. The zone was also home to the daily 200-SMA (green) and a double bottom pattern, both of which were expected to aid buying interest going forward.
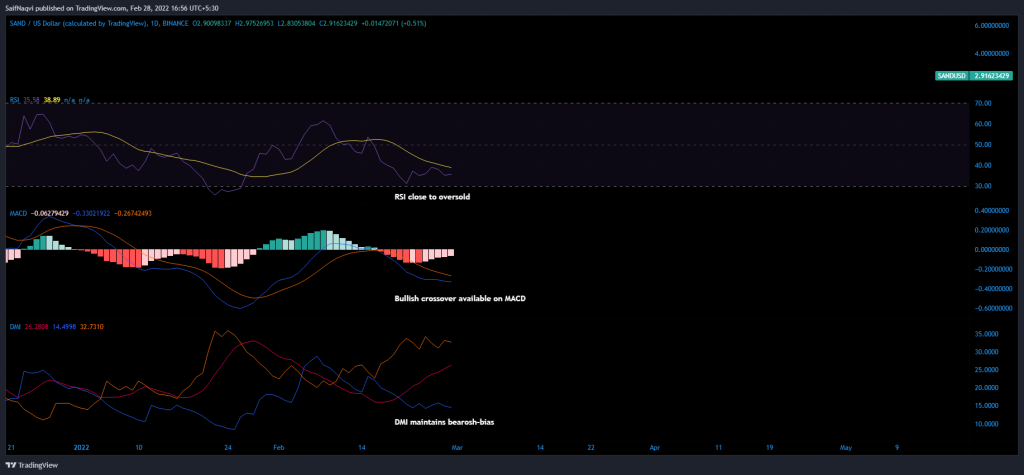
Furthermore, the daily indicators were also shifting to favorable positions. The Relative Strength Index was a few basis points away from the oversold territory, prompting a buy signal, while the MACD was encroaching a bullish crossover as the fast-moving line (blue) caught up to the Signal line (orange).
SAND would be in lieu of a 45%-55% upwards run this week should the abovementioned positives generate longs at the current demand area. An extension to 8 February’s swing high at $4.86 would also be entertained in a highly bullish outcome. A key area to overcome lay the 50% Fibonacci level, backed by the daily 20-SMA (red).
However, a breakdown cannot be overlooked, with the Directional Movement Index maintaining a bearish outlook. If a daily candle develops below $2.55, the next area of defense lay only at $2. The resulting move would highlight a 30% decline from SAND’s press-time level.
Conclusion
The Sandbox is an enticing buy at the current price level. Its price was upheld by a demand zone, a double bottom setup, and the daily 200-SMA (green). Those with lesser risk apatite can wait for the DMI to overcome its bearish bias before taking up long positions.