


VeChain is expected to advance to the upper boundary of its wedge moving forward. Bullish readings on the lesser timeframe present a 14% upside and underpin VET’s near-term trajectory. Once a new high is formed, expect sellers to take over as the broader trend remains bearish. At the time of writing, VET traded at $0.928, up by 6.7% over the last 24 hours.
VeChain 4-hour time frame
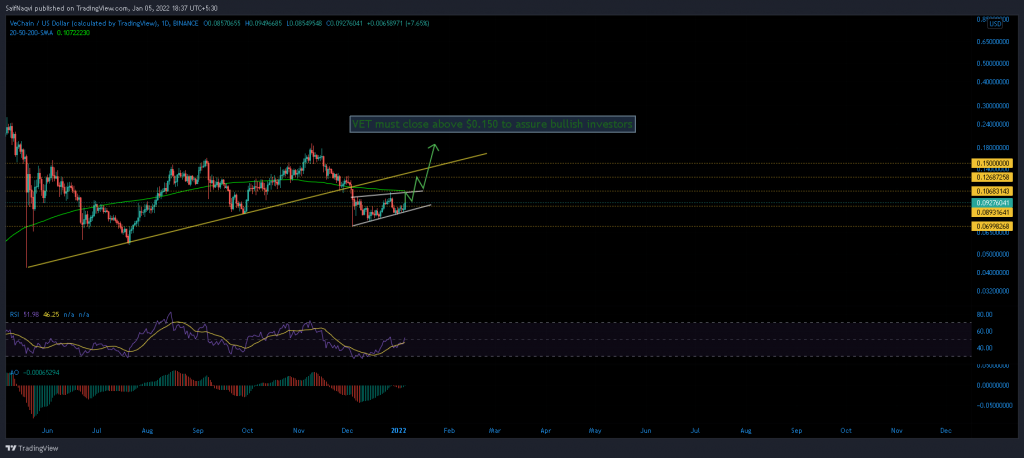
VeChain’s price has looked bearish since closing below a supporting trendline on 4 December. The trendline, which stretches from late-May levels, now runs as resistance on the daily timeframe. On the lesser time frame (4-hour and hourly), however, VET is making progress. The price traded above a resistance mark of $$0.098 and the 4-hour 200-SMA (not shown) within a rising wedge pattern.
Should bulls add on to their momentum, VET can register another 19% hike and form another high at $0.106-resistance. However, a breakout above this barrier could be tricky due to the presence of the daily 200-SMA (green). A broader market rally could key for an upwards breakout. Finally, a close back above the trendline and $0.150-resistance would help flush out a majority of sellers. Bulls would be cruise control thereon.
On the other hand, a close below 4 December’s swing low of $0.069 would open the floodgates for another 19% sell-off. The most reliable support would be found at 23 July’s low of $0.055.
Indicators
VET’s indicators were amidst a recovery but bulls were yet to gain control. The daily RSI has been unable to break above 50 just yet as selling pressure was not fully exhausted.
VET’s bearishness was also evident on the Awesome Oscillator, which has traded below its half-line since November 2021. Although successive green bars on the Awesome were encouraging pessimism would remain until the index spikes above the half-line.
Conclusion
VET’s near-term looked optimistic but there were a number of question marks surrounding its long-term trajectory. The RSI and Awesome Oscillator were neutral as the price traded below its daily 200-SMA. To fall within a clear bullish bias, VET needed to close above $0.106 and flip a long-serving trendline to support.