

Christmas is just around the corner and Red, Green are the classic colors of this festive season. Owing to the persistent instability, asset prices across the board have been dropping and the financial markets seem to be dressed in red at the moment.
On Monday, around $645 billion was wiped out from the US stock market. Finance and Tech stocks like Oracle, Microsoft, Meta, Google, Citi Bank, Goldman Sachs, JPMorgan Chase, and Bank of America Corp were among the ones that took the hit.
Crypto is essentially a variant of finance and technology, and evidently, assets from this space had to bear the brunt of the macro bearishness. The aggregate value of all cryptos dropped by roughly 2% over the past day to $851.55 billion. Top tokens like Bitcoin and Ethereum shed 1%-3% of their respective values.
Parallelly, yesterday’s top gainers were today’s top losers. Crypto.com’s native token CRO was a part of the top gainers’ list a day back. However, at press time, it stood fourth on the top losers’ list. Similarly, Shiba Inu registered a long green candle on Monday. On Tuesday, however, it was the asset with the sixth-highest loss.
Also Read: Whopping 1 Trillion Shiba Inu Tokens Transferred To Coinbase
Buying Power Higher Than 2021’s Bull Run
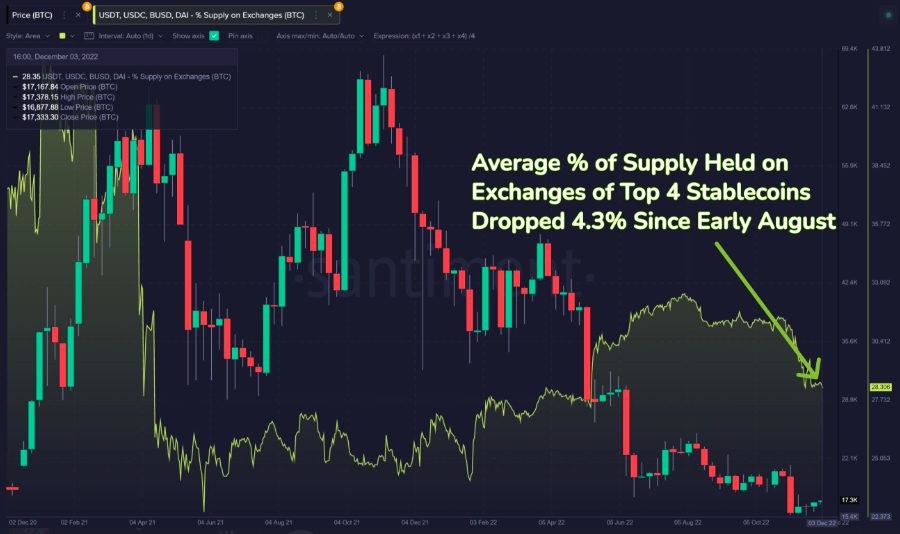
Irrespective of the price dip, the buying power continues to hover around high levels. Chalking out the current status of the same, a recent tweet from Santiment affirmed,
“Buying power is still higher than during the 202’s bull run.”
The stablecoin supply on exchanges, interestingly, is on the drop. As illustrated below, the average percentage of supply held on exchanges of the top 4 stablecoins—USDT, USDC, BUSD, DAI—was around 32.5%, 4 months back. After shrinking by more than 4%, the same currently hovering around 28%.
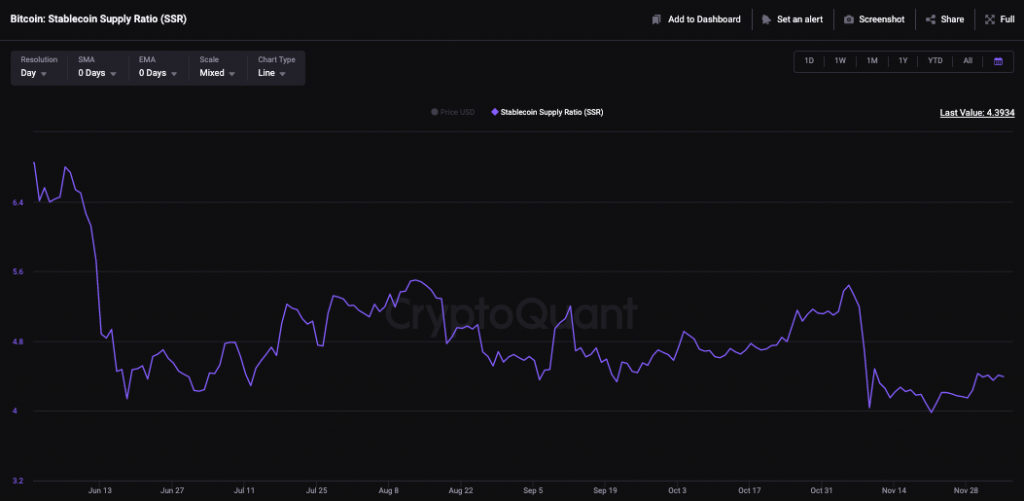
In fact, the state of Bitcoin’s stablecoin supply ratio reaffirmed the said narrative. The value of this particular metric, as such, depicted the power status between BTC and stablecoins by comparing their market caps. Low values mean a high stablecoin supply with investors and indicate the formation of potential buying pressure and possible price rises.
At the beginning of November, this metric’s value was hovering around its multi-month high of 5.44. Post that, nonetheless, it noted a steep drop and has been revolving around 4.3 of late. The same, in essence, hinted that there’s dry powder lying on the sidelines for investors to divert towards Bitcoin and instigate a buy-spree.