


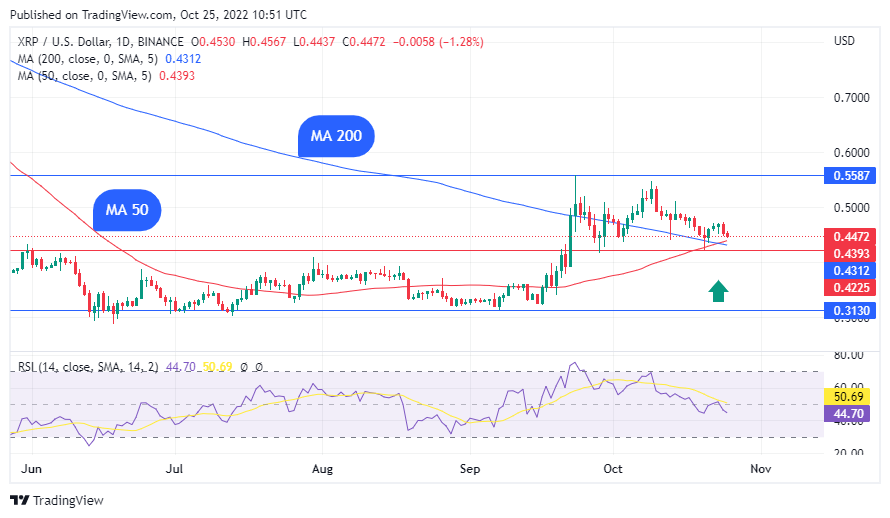
XRP, the sixth largest cryptocurrency by market cap, has formed a “golden cross” pattern for the first time in 15 months. Analysts regard the formation of a golden cross as a bull market indicator. On October 23rd, XRP’s daily moving average (MA) 50 crossed above the moving average (MA) 200, validating the “golden cross” price pattern, a long-term bullish indication.
Will the formation of a golden cross lead to an XRP rally?
Analysts usually relate the formation of a golden cross as a bullish development. Moreover, this is not the first time the golden cross has appeared on the XRP charts. The indicator has previously appeared on the token’s charts a few times. The last time it happened was on July 17, 2021. Furthermore, it was followed by a 176% price rally. The token reached a high of $1.41 before reversing direction to the downside.
Analysts and traders usually interpret the golden cross as a sign of a clear upswing. As a result, the most recent cross may spur additional price increases by increasing purchasing interest from trend-following traders.
However, the golden cross is not all-encompassing. One should still exercise caution while buying into an asset. There are times when buyers are caught on the wrong side of the golden cross, as moving averages follow the price. Also, when an asset is already overbought and due for a downturn, a crossing can occasionally take place.
At press time, XRP was trading at $0.446857, down by 2% in the last 24 hours. The token is also down by 7% in the last week, and down by 10.2% in the last two weeks. Moreover, it is 86.9% down from its all-time high of $3.40, attained on January 7th, 2018.