


A metaverse expansion, new E-sport alliances, and a clearer future vision have attracted a large number of crypto investors towards Zilliqa. The altcoin rallied as high as 235% since 16 March, making full use of a risk-on broader market and renewed bullish sentiment. However, the price has been unable to close above a key level and the hourly indicators now projected a correctional period before the next wave upwards.
ZIL Daily Chart
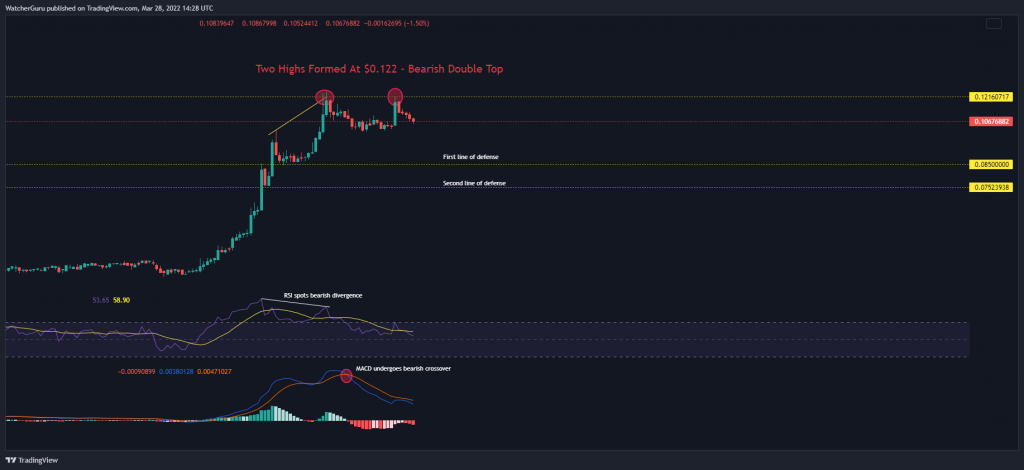
Zilliqa was beginning to show signs of exhaustion after a non-stop rally on 16 March. For one, the price formed a double top pattern after failing to close above $0.122. From a technical standpoint, double tops are bearish patterns that normally precede corrections.
Secondly, the hourly Relative Strength Index has constantly slipped lower over the last 48 hours after flashing a bearish divergence. The RSI is one of the most relied upon indicators by traders to judge market momentum. It creates divergences by moving against the price, indicating a possible shift in market trend. Finally, the hourly MACD, another well-known indicator, aided sellers after forming a bearish crossover on 27 March.
Should these signs trigger a downwards move, ZIL would sip towards its first support level of $0.085. Slightly lower lay ZIL’s second defensive resort at $0.75. Both regions were expected to quell any incoming correction and trigger the next market uptrend.
Hype Lives On
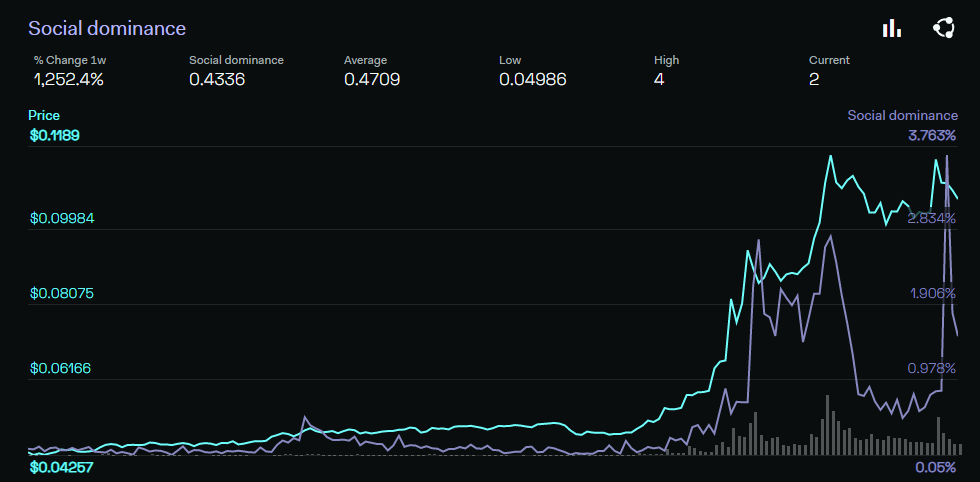
While some might expect a prolonged correction after ZIL’s sporadic ascent, hype trading was still a relevant factor and the same must not be overlooked. As per LunarCrush, ZIL mentions have been skyrocketing on social media platforms, with its weekly social dominance up by 1,255%. The next logical target lay at $0.140 and until the hype train cools down, ZIL’s prospects would look promising.