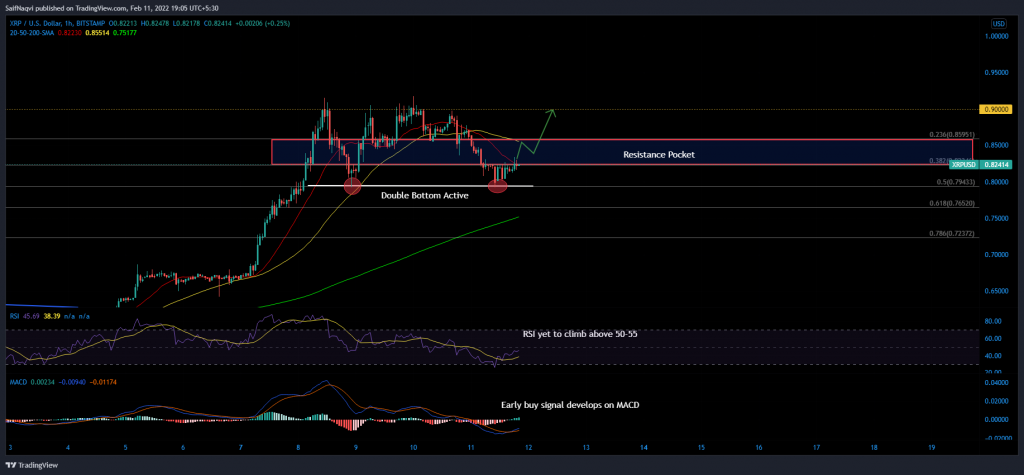
XRP was amidst a recovery on the hourly chart as the RSI attempts a full U-turn from 30 to 80. The region between $0.823-$0856 was key to XRP’s near-term success as bulls line up a comeback to $0.90 during the weekend.
XRP Hourly Chart


XRP’s near-term bullish rally was dependent if whether its price can get past $0.74-$0.85. The region harbored both the hourly 20 (red) and 50 (yellow) SMA’s and the 4-hour 20 SMA (not shown) as well.
The buy-side would take heart from a double bottom setup established at the 38.2% Fibonacci level (calculated through XRP’s jump from $0.67-$0.92). A buy signal on the MACD was also expected to generate momentum as the Fast-Moving line (blue) crossed above the Signal line (orange). A close above the upper limit of the resistance zone would likely see another 5% extension to $0.90. Overall, the move accounted for a 10% surge from XRP’s press time level.
However, it is worth noting that the buyers were not supported by a favorable RSI just yet. The index, although amidst an uptrend, had not risen into bullish territory above 55. A rejection at 50 would be a sign of weakness, suggesting that XRP was not ready for its next leg upwards.
The following move could see XRP shift back to the 50% Fibonacci and eye a triple bottom setup. The hourly 200-SMA (green) could even come into play in case XRP weakens below $0.794.
Conclusion
XRP’s near-term recovery depended on a crucial overhead resistance. While bulls were favored for a breakout, a risk-off broader market must be taken into account. Hence, investors must be prepared for both outcomes during the weekend.


