


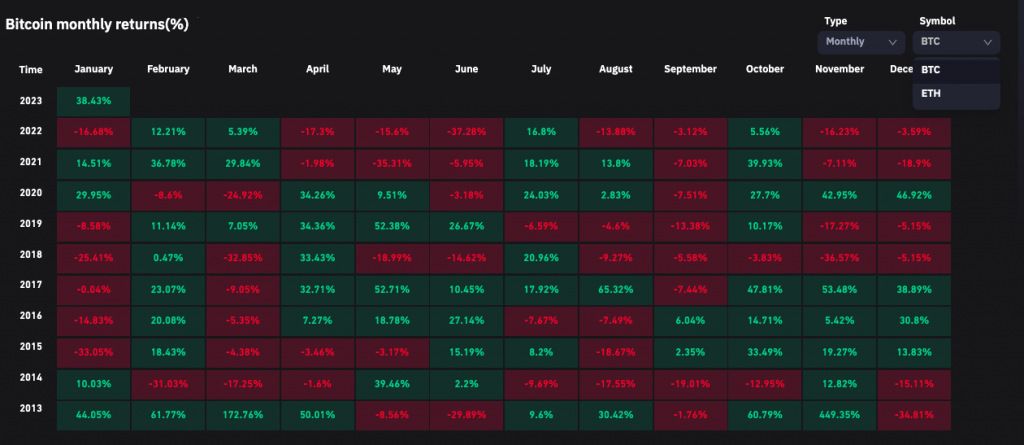
Bitcoin currently seems to be on track to make January 2023, its best January since 2013. Around New Year, it was priced at around $16.5k. In less than four weeks’ time, the price of the asset is already up to $23,000. As a result, the returns so far in January stand close to 40%.
Six times prior, Bitcoin investors have fetched negative returns in January, while during the other four times, they’ve fetched double-digit positive gains. Only in 2013, the number stood slightly higher, at 44%.
Also Read: This Bitcoin Strategy Has a 100% Win-rate in 8-Years
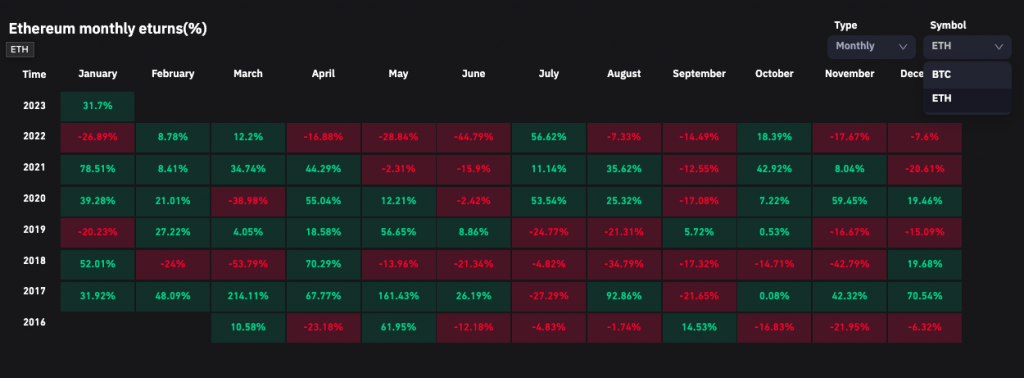
That, however, has not been the case so far for Ethereum. The largest altcoin was trading in the $1.1k-$1.2k bracket during the initial days of January. At press time on Friday, it was seen hovering around $1.5k. As a result, its 2023 RoI stood at 31%, while in January 2021 and 2018, it registered gains in the 50%-80% bracket.
Also Read: Ethereum Drops 9% Against Bitcoin: Are Altcoins Suffering?
Will Bitcoin, Ethereum note a bullish extension?
Going forward, however, the pace of Ethereum’s incline is expected to rise. Given that the Shanghai upgrade is slated for the first quarter of 2023, the community is gradually turning bullish.
Additionally, Ethereum recently re-stepped into the deflationary zone earlier this week, thanks to the rising NFT sales. Last year’s EIP-1559 upgrade introduced a base-fee burning mechanism post every Ethereum transaction. It helped set the stage for Ethereum to become deflationary. Thus, if the number of tokens burned continues to eclipse the number of issued tokens, then the price would gradually rise due to a decrease in supply.
Read More: Here’s How NFT Sales Pushed Ethereum Into the Deflationary Zone
From the technical perspective, Bitcoin also seems to be gearing up to extend its rally. As shown below, a golden cross is on the verge of materializing on the daily chart, which is a positive sign.
A golden cross usually occurs when a short-term moving average overtakes a major long-term moving average to the upside. So, if the 50 DMA [blue] ends up breaking past the 200 DMA [yellow], another price uptrend phase can be anticipated.