


Ripple registered a monumental victory against SEC last week. With XRP deemed ‘not a security’, community members were quick to confirm a full-blown bull market. At press time, most assets were consolidating, and Bitcoin continued to defend its $30,000 range. Now, this XRP ruling was a massive moment for the industry so the positive sentiment should have carried through. So this begs the question…
Why is Bitcoin failing to break range?
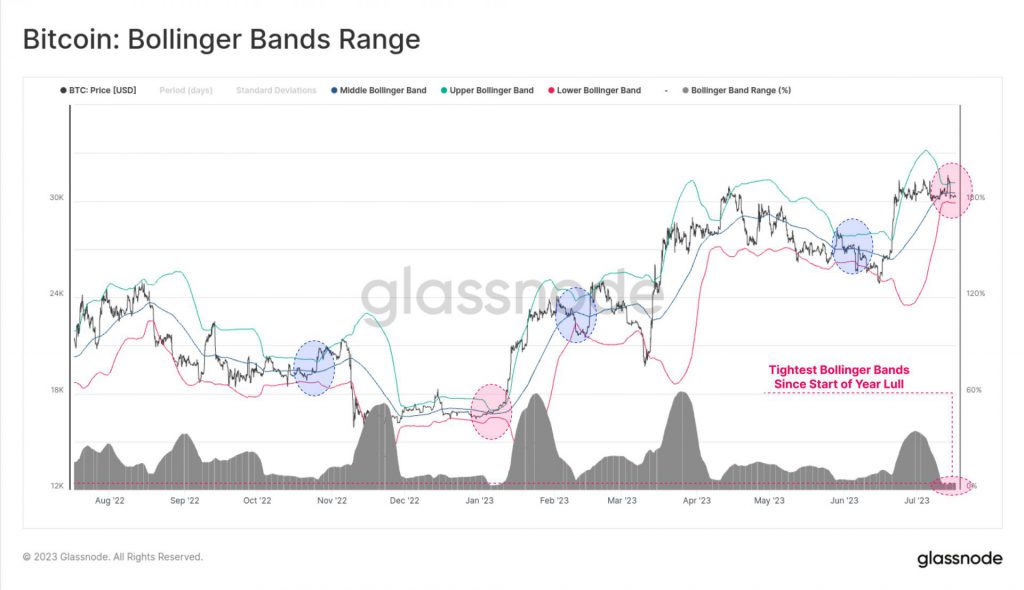
According to glassnode analytics, there is an incredible lack of volatility in the Bitcoin market. The chart above illustrated the 20-day Bollinger Bands experiencing an extremely tight squeeze. With a price differential of 4.2% between the upper and lower bands, it is the most tepid BTC price action since early January 2023. While the Bollinger Bands are only indicative of low volatility, other factors are possibly playing a part.
Since the beginning of April 2023, Bitcoin short-term holders’ supply(1day-6months) has consistently declined. This group of retail investors has locked profits for the majority of 2023, as BTC has been on the rise year to date. While a bullish narrative is in play, these investors are probably either breaking even or off-setting losses from 2022.
A similar conundrum is witnessed with BTC miners. With hashrate reaching new ATHs, Miner Exchange Inflows have steadily increased. The upcoming halving would see the mining reward decrease in half. Hence, miners often liquidate their holdings in order to replenish them before the event takes place. In a recent article, we highlighted how miners might be positioning themselves, as Rioa Platform, made a major purchase of 33,280 mining rigs from MicroBT. The total cost tallied up to $163 million, as most of these organizations are ramping up their setup.
Also Read: Bitcoin ‘Difficulty’ Adjustment May Trigger $35,000 Re-test
Another Leg Down Before Up?
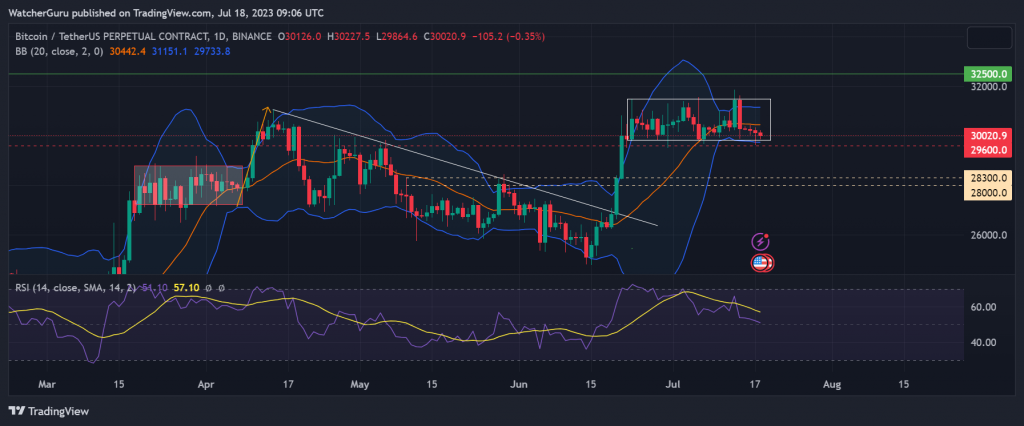
Now, analyzing the current market structure with respect to Bollinger Bands, we can draw a similarity from a previous range breakout. Between March 18 and April 8, BTC traded between $27200-$28750. It was just before BTC tested $30,000 for the first time in 2023. Now, the asset registered an uptrend from its range but during that particular breakout in April, BTC maintained a bullish position with respect to the moving average line(orange line) of the Bollinger Bands. It also never consolidated near the bottom range.
At press time, Bitcoin is currently at the bottom of a range, and its price is positioned under the Bollinger Band moving average. It is clear at the moment, that bearish pressure is more prevalent, and this is after the recent swing in positive sentiment. BTC remains on the right side of the market from a yearly perspective, but right now, it has a clear path under $30,000. A re-test down to 28,000-$28,300 is most likely under current conditions unless another positive development swings the market yet again.
Also Read: U.S. Dollar Setting Stage for Bitcoin to Soar