


It is a very tricky state to be a Bitcoin trader at press time. And if leverage is involved, the daily chart is the stuff of nightmares. Now, the previous statement might be a tad overblown, but the confusion is not. After a pretty bullish week, the largest asset is somewhat appearing ‘weak’. The daily chart is still maintaining a positive setup, but its recent candle close might be signaling a warning. With the weekend approaching, we will take a look at how BTC’s price action might cool down going forward.
Also Read: Ordinals Renewed Bitcoin ‘Building Culture’: Ethereum Founder
12-hour ‘pattern’ & ‘supply zone’ dilemma for Bitcoin
Market volatility is a double-edged sword. The Bitcoin Spot ETF development brought a sense of exhilaration to the community. However, the recent Binance FUD dampened the mood. Yet, that wasn’t the prime catalyst. BTC’s daily chart has just emulated a very common pattern observed over the course of 2023.
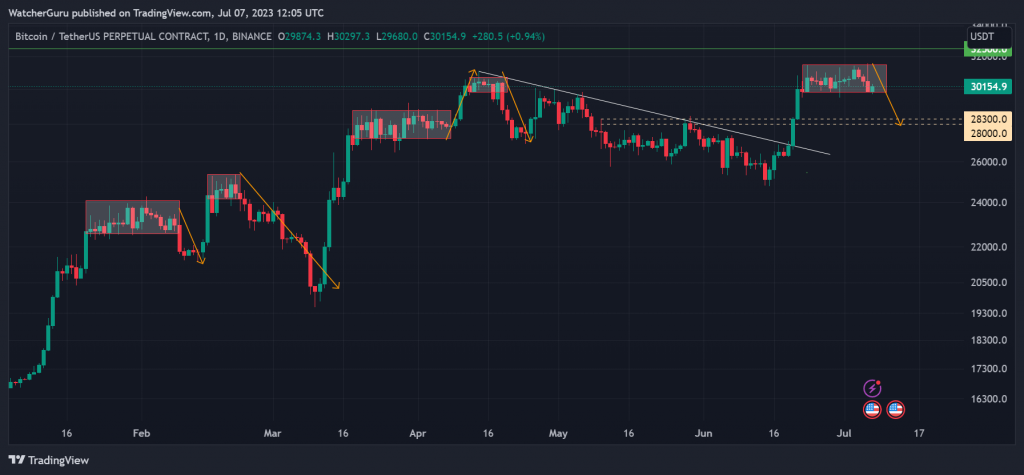
In 2023, every time Bitcoin has undergone a massive rally, it initially held a higher position before undergoing correction. As illustrated in the chart, besides a period in March-April, consecutive declines have been a theme. At the moment, a similar pattern is again panning out. Initially, the market expected a move up, since the asset was near its yearly high. However, it is likely going to repeat the same type of drop. Besides mirroring previous correction patterns, the 12-hour chart formed a massive supply zone gap.
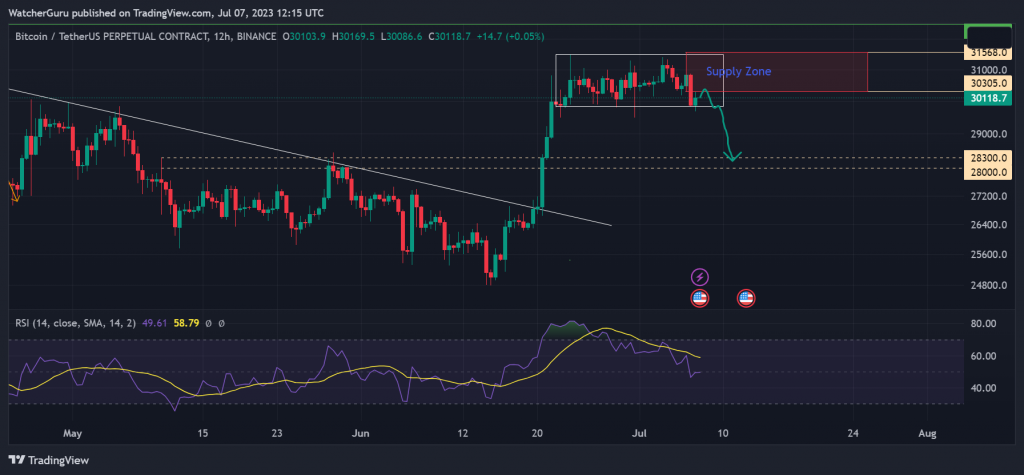
As observed, Bitcoin is currently at the lower half of its consolidation range. However, the bearish context has strengthened over the past day due to the formation of a supply zone. A massive bearish engulfing can be noticed after BTC reached a new yearly high, which is never a good sign. Now, considering Bitcoin closes a 12-hour candle below the box, a correction down to $28,300-$28,000 is plausible. The Relative Strength Index is currently neutral suggesting a cooldown between bullish/bearish pressure.
How to navigate on the weekend?
This is one of those situation where there isn’t a correct answer. While the market is edging towards a decline, a bullish setup can also be explained. A drop down to $28,000 is technically acceptable from the daily chart standpoint, however, that wasn’t entertained till 2-days back. In all essence, it is ideal to remain flat for the time being. A more clear direction will be available soon for the investors, so waiting on the sidelines is the most risk-averse strategy.
Also Read: JPMorgan: Bitcoin ETF Approval Unlikely to Transform Crypto Market