


On 8th July, Bitcoin reached a monthly high of $22,500. The bullish momentum was built over the week, and minor gains were witnessed. While Q2 2022 concluded with a 57% correction for BTC, some of the industry was optimistic that the bottom was in. While multiple analyses suggest that direction, the present pattern is less than favorable.
Bitcoin daily chart

At press time, Bitcoin was consolidating near $20,500. While BTC remained above its recent low range of $19,000, its present pattern is taking the shape of a bearish flag. On the daily time chart, Bitcoin has registered a couple of higher highs and higher lows within a parallel channel after a significant drop in value towards the end of June. As observed and identified in the chart, it is presently moving toward a bearish breakout.
Trading volumes are suggestive of increased selling pressure as well. On 8th July, after BTC reached the local top, the asset closed its daily candle on a negative, with the highest trading volume since April. Right now, a deflection from the lower trend line is possible, but a pattern breach would lead to a re-test between the $16,400 and $17618 range.
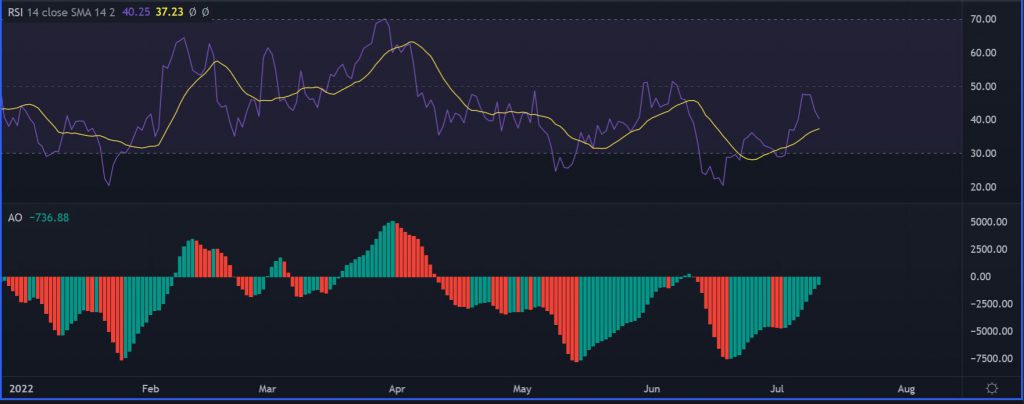
The relative Strength Index or RSI has also been bearish since late April, and the indicator hasn’t crossed the 50 mark suggesting higher sell intensity in the exchange. Similarly, Awesome Oscillator was also dominated by bulls, but reversal signs were also evident.
A Silver lining for Support?
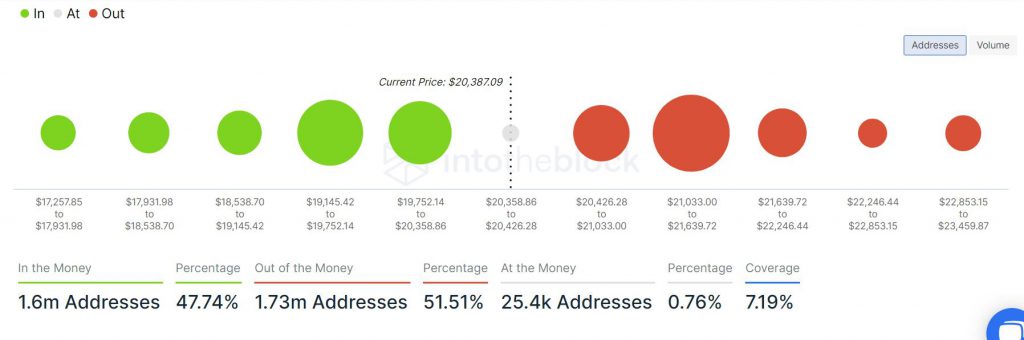
While the technical side of the market is still bullish for Bitcoin, the on-chain side might convey a bit of hope. Between $19,145 and $20,358, BTC has over 1 million addresses invested in approx 800k BTC. It is strong Support which may hold considering retail selling pressure has primarily dropped since last month. However, the Support weakens after $19,173, and a collective correction below that range would undoubtedly take Bitcoin close to $15,000.
After a bullish week, Bitcoin’s resilience will be tested again, and bears might try to regain the upper hand on the asset.