Ethereum is evidently at an indecisive juncture of late. It closed last week on a bearish note but managed to pose a recovery during the weekend. The new week, nonetheless, began on a bearish note again and the same sluggish state has continued over the last couple of days too.
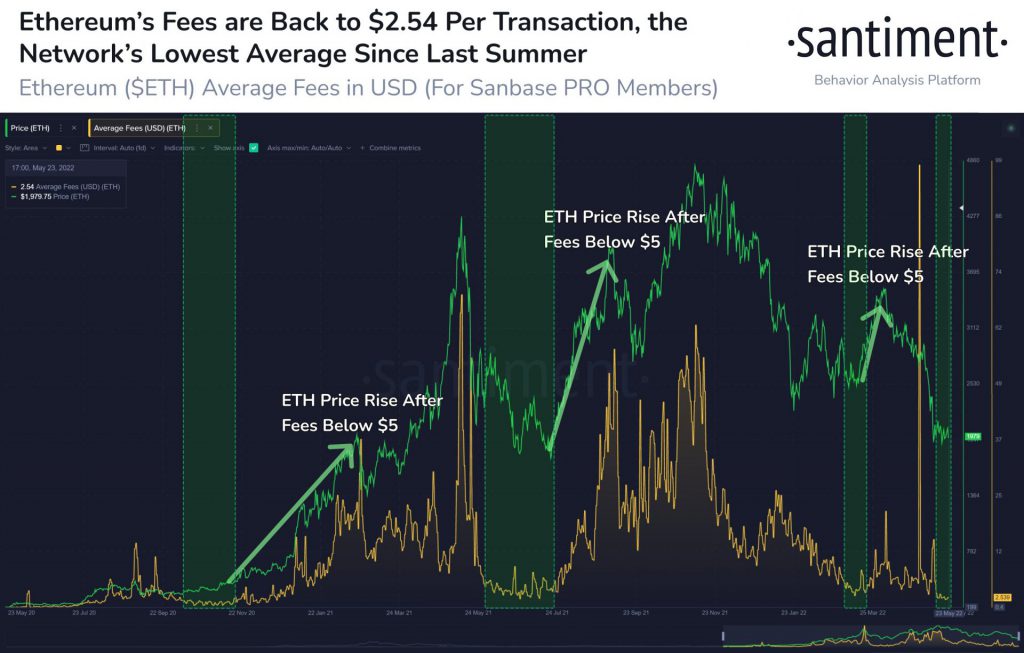
However at this stage, per history, there are chances for Ethereum to bounce back. Ethereum’s average fees are currently at an extremely low level. Per data from Santiment, users have merely been paying $2.54 per transaction currently. As illustrated below, this is the lowest ETH cost level since last year’s July.
Highlighting how ETH’s price has reacted during such periods in the past, Santiment brought to light,
“Historically (but by no means automatically), ETH prices rise after average transactions dip below $5.”


A brief rally in play for Ethereum?
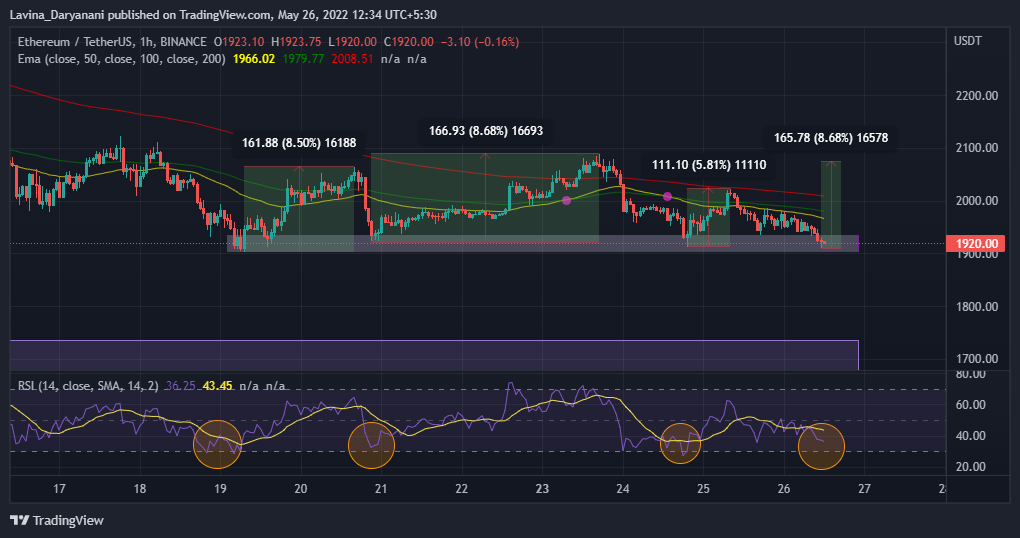
Leaving aside the transaction fee coincidence, Ethereum had been prepping for a brief bounce back over the past day. On the hourly, it did touch the roof of its liquidity zone extending from around $1905 to $1934 on Wednesday and bounced back slightly. However, it couldn’t move beyond its 50 DMA [yellow].
So, after consolidating for a while, ETH’s price tumbled back into the said price band during the early hours of Thursday by registering a host of red candles on the shorter timeframe charts.
Nonetheless, an interesting trend can be noted below. As illustrated, whenever Ethereum has dipped its toes into the said zone over the past few days, its price has briefly rallied after that every time. The initial stages have mostly coincided with the RSI bottoming in as well.
The incline during the first instance was around 8.5%, while during the subsequent two attempts, the alt leader managed to pull off an 8.7% and a 5.8% rally. When calculated from Thursday’s lowest point, a similar 5.8%-8.7% rally would push back Ethereum above $2k.

Having said that, it should be noted that there is not much bullish momentum present in the market at the moment. At press time, the RSI was hovering around the oversold region and the tip of the curve was seen pointing down south, indicating that the bottoming out was not yet completely over.
In fact, per data from ITB, sellers have been dominating the market. Just over the past three hours, for instance, 45.09k additional ETH had been sold than bought.
So, if sellers continue to assert their influence and Ethereum loses the floor of the current band as support, the odds of it crashing down to its next major liquidity zone around $1700 would intensify. In short, history isn’t necessarily in a position to shield Ethereum’s future.


