


Ethereum is off to a bumpy start in Q2 2022. While the asset has dropped by 5.76% since April 1st, it is currently down 12% from its monthly high of $3580. While price movements remain volatile as ever, ETH supply continues to be a major indicator to understand trend reversals.
In this analysis, we will be addressing a condition that might affect Ether‘s price in the long term. With the involvement of investors becoming more prominent for top crypto assets, understanding supply shock is imperative.
Ethereum Supply Shock; what is the basic understanding?
In any market, price is fundamentally driven by supply and demand. A simple association to quantify both these conditions is called a Supply Shock. Supply Shock is the unavailable supply divided by available supply, which is carrying intent in the market.
Derivations of the equation include exchange supply shock and liquid supply shock among other examples. Now, supply shock can be caused by numerous factors in the market, and on a macroscopic level, these can pile up to create a positive or negative shock. A negative shock means, a sudden decrease in supply, which may increase the price of the asset, and vice versa, is a positive shock.
Analyzing Current Market Signs
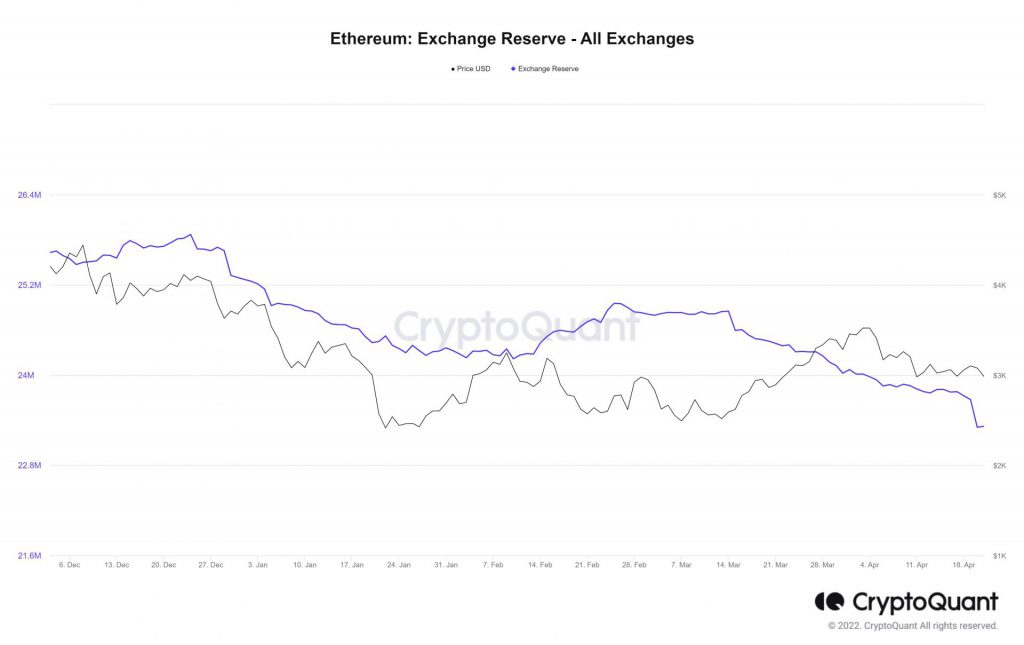
Ethereum Exchange Reserve is a good parameter to analyze supply shock and a strong example was observed over the past week. It is well-known that the ETH supply has been decreasing on centralized exchanges since the implementation of EIP-1559 and ETH2 staking contract. In April itself, between 1st to 21st, over 754,000 ETH worth $2.2 billion has outflowed from exchanges. Interestingly, a majority of it was flown out last week. 405474 ETH existed between 18th April and 21st April, and it caused a major negative shock.
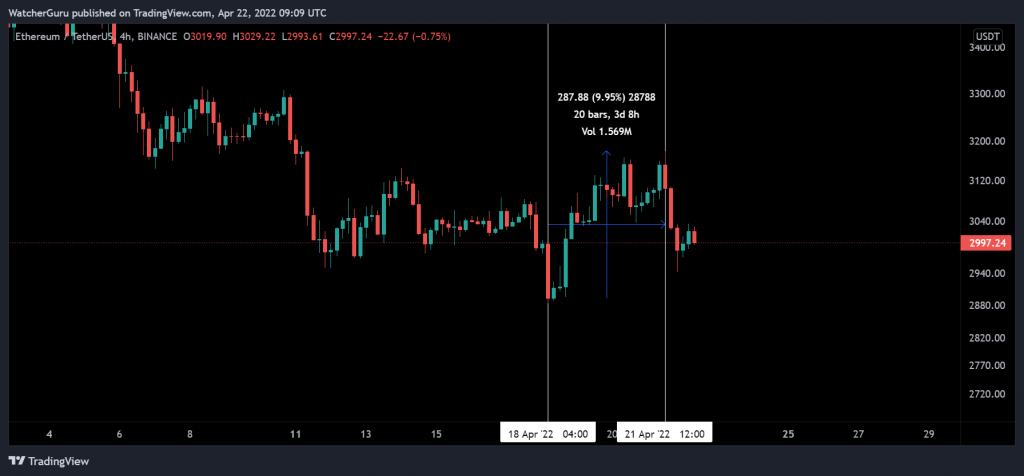
As observed in the chart above, Ethereum registered a strong recovery of 10% at one time, during the aforementioned period. This could be taken as a classic example of a negative supply shock, when the reduction of supply, temporarily improved the price. However, the effects did not last long, as, at press time, Ethereum was back under $3000.
What other factors play a role?
Over the past year, Ethereum supply has continued to exist on exchanges, which means Ether should have been on a gradual rise in valuation. That has not been the case because unlike Bitcoin, Ethereum has an unlimited issuance supply. Now, the introduction of its EIP-1559 protocol, where some ETH is burned every time a transaction takes place, was supposed to make Ethereum deflationary. That has not been the reality, yet.
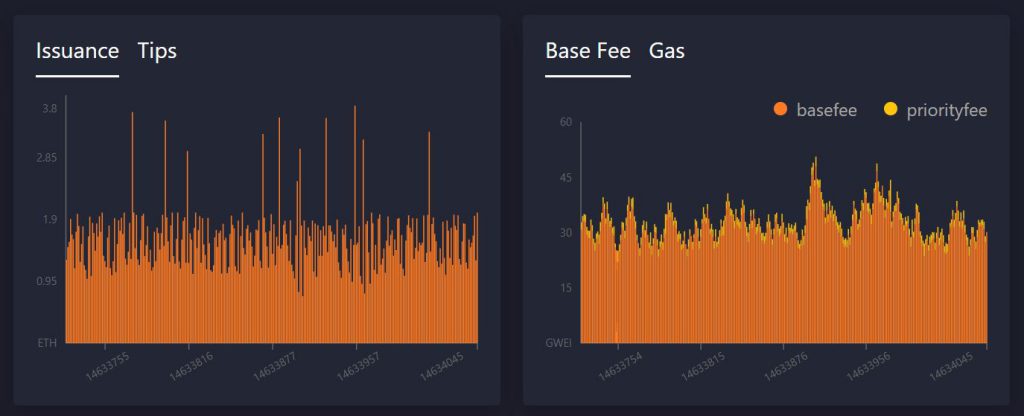
According to statistics, since EIP-1559, 2,147,602 ETH has been burned which adds up to around $6.4 billion. While that seems like a huge amount, it is important that at the same time, 3,500,294, ETH entered the circulation supply. This means more Ethereum is still entering the space. The net reduction percentage is currently at 61%, and unless it is above 100%, the amount of ETH burnt is still higher than the amount of the ETH issued.
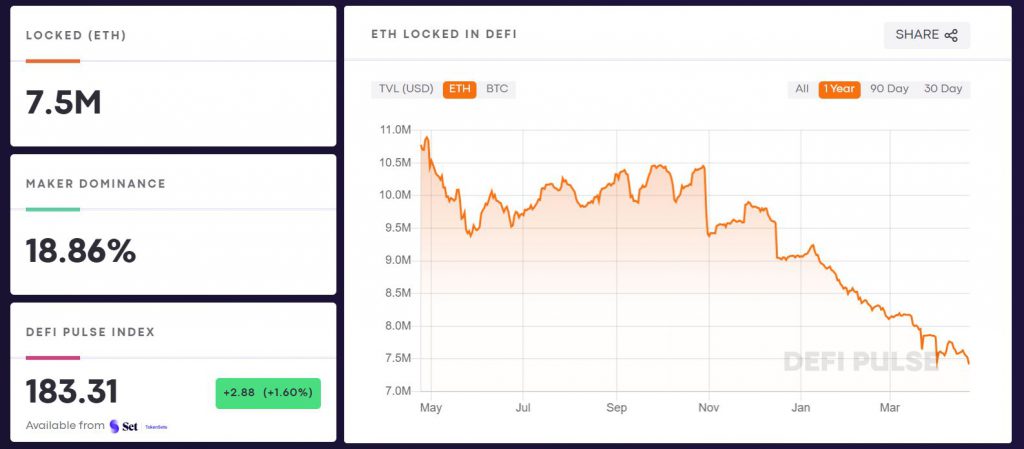
Lastly, another factor to be considered is the total sum locked in DeFi or Total Value Locked(TVL). Surprisingly, TVL for Ether has dropped as well over the past few months, and currently, it is on a decline as indicated in the chart. Ergo, more Ethereum in circulation.
So where is the next Supply Shock taking the market?
The next major supply shock for Ethereum remains completely subjective to these parameters. As identified, a small supply shock between 18th-21st April led to a rally, but due to the overall increase in circulation supply, the demand is yet to dominate on a macroscopic level.
EIP-1559 remains at a nascent stage, and down the road, the burning protocol could lead to eventual deflation functionality. However, at press time, the landscape remains open to both positive and negative supply shocks, as volatility leads market sentiments.