


SafeMoon is a new cryptocurrency that featured in 2021. Moreover, this crypto project is a community-driven approach for decentralized financial systems. It has 1 billion coins pre-mined after its initial launch. And now more than 2 million holders and 585 trillion total MSM from CoinMarketCap. In this Safemoon Technical Analysis, we focus on price patterns, past statistics, and RSI to predict the future movement of Safemoon.
Analyzing The Price Of Safemoon
One popular method used in predicting prices involves taking into account recent occurrences through standard technical analysis techniques such as identifying horizontal support. And resistance levels, calculating moving averages and calling on indicators.

Safemoon Technical Analysis
Identifying Support & Resistance Levels
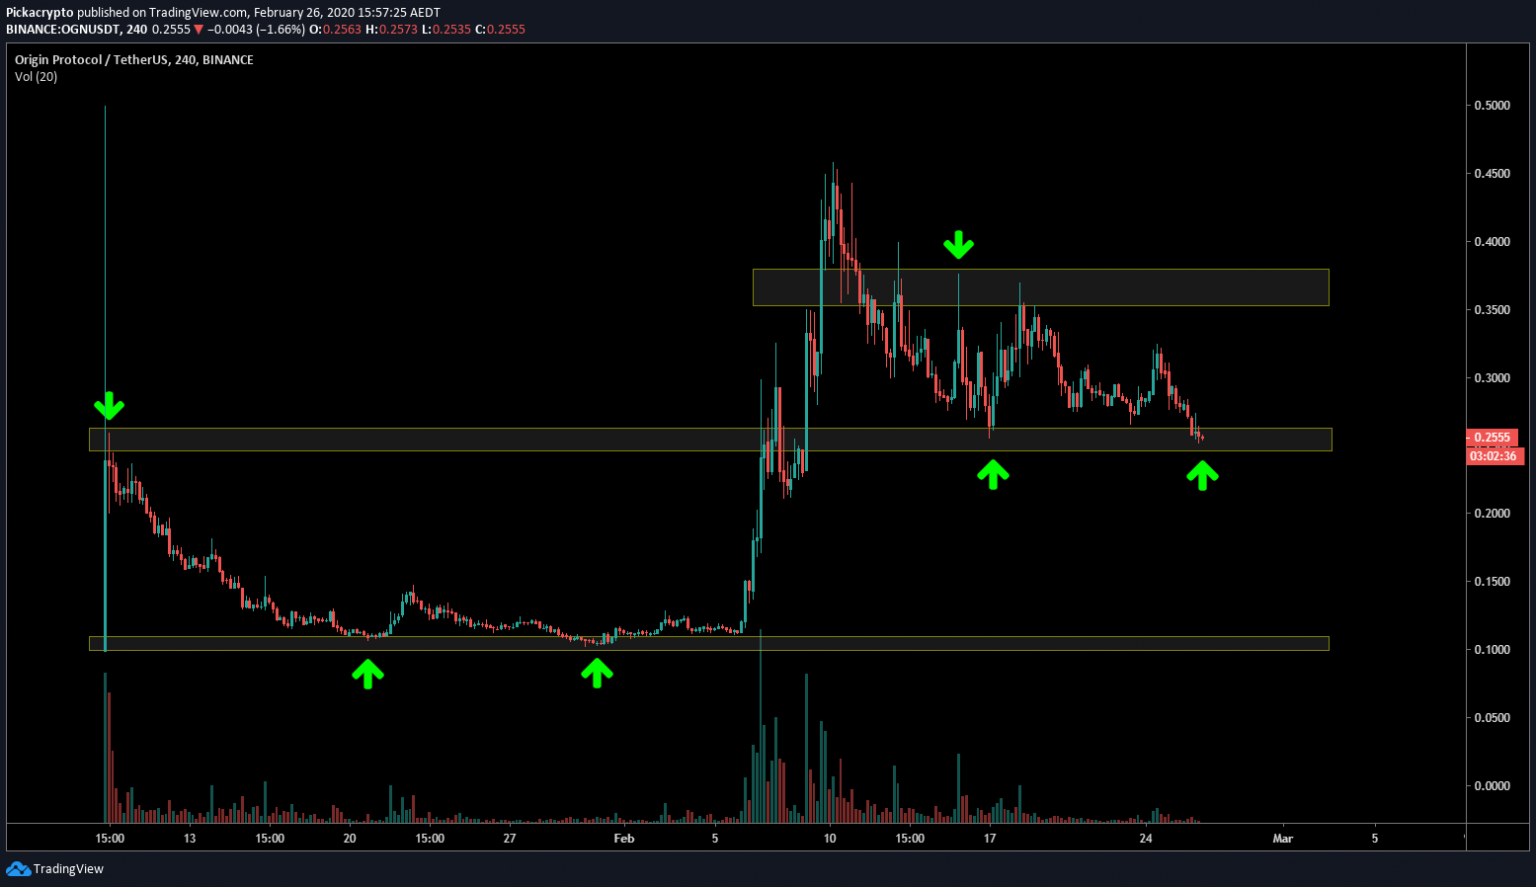
SAFEMOON has many interplays with the areas marked in yellow and where green arrows appear. Traders can use these markers to set up buy orders or sell their tokens. Based on what they believe will happen next price-wise. In this case, Safemoon is surging thus ripe for sale. The prices are going up, and this indicates good times for holders.
Using Moving Averages
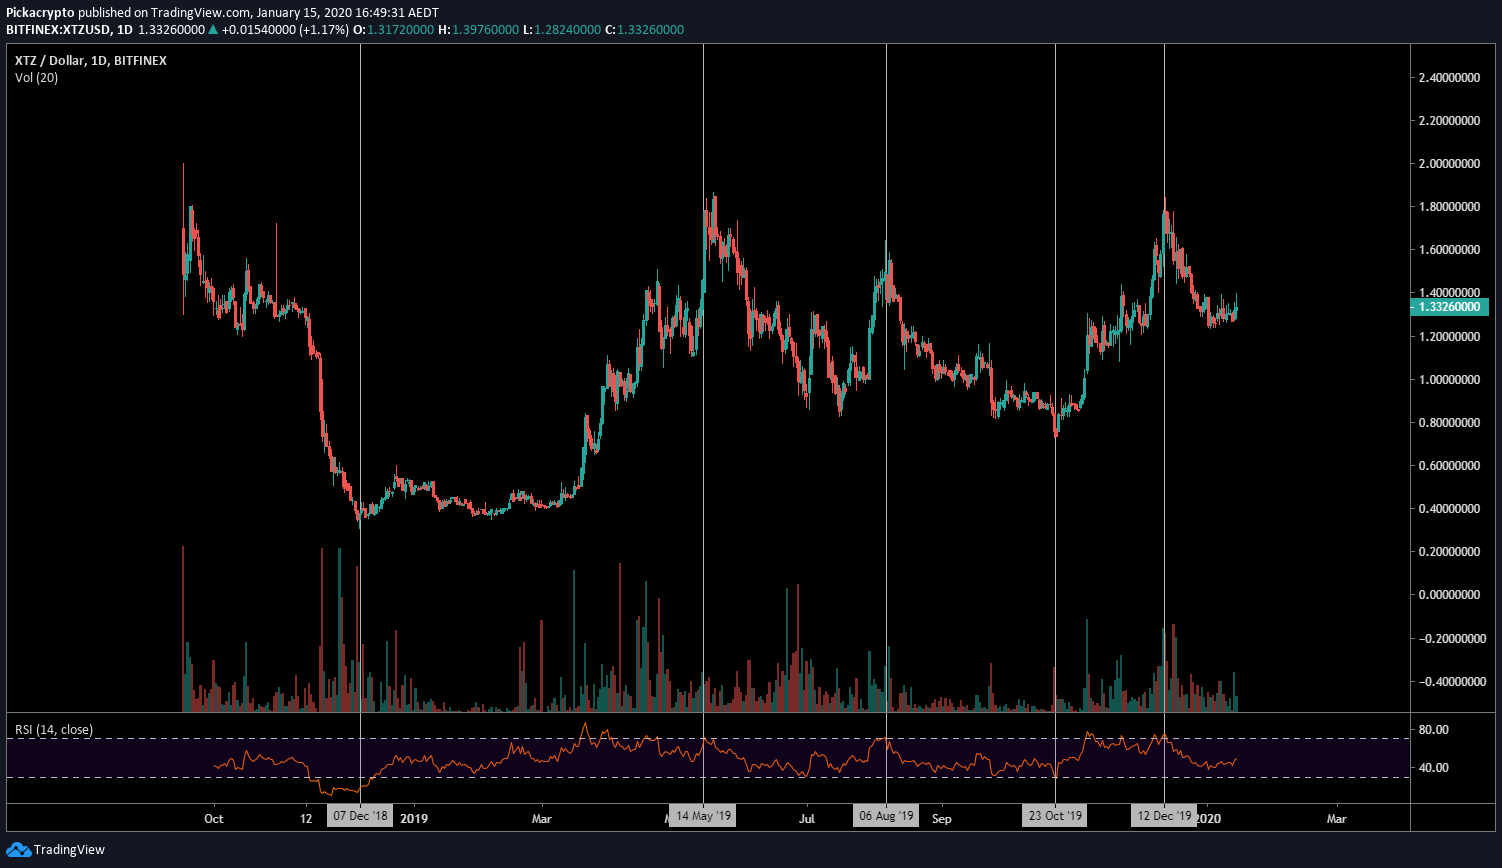
If you want to understand the market, then you must know about moving averages. Moving average charts are utility to traders who use them as indicators. A guide for when they should buy or sell their cryptocurrency. Besides, not only to ride trends but also generate higher profits. The MA, as indicated in the map, shows that safemoon is in the right trajectory. It is almost hitting the all-time high once again after a low start.
The following image shows the importance of a resistance level in determining prices. There have been many interactions between price and this 1D 200MA, represented by a pink line running through the chart. Meaning, it will continue to be an essential tool when predicting prices.
Utilizing Indicators
Indicators are a set of technical variables that help traders predict the direction of prices. They take into account various factors such as time, volume, and momentum. All this to state whether SAFEMOON may go up or down over future periods. Although they cannot tell you with certainty what the value will be at any given point. These indicators can still provide valuable insights into trends within different markets.
The indicator, the Relative Strength Index or RSI for short, is often found at the bottom of the charts. It considers previous prices and volume before deciding whether a coin like Safemoon will be oversold or have buyers emerge from their caves with cash in hand.