


A crypto flash crash on early Thursday was responsible for an altcoin sell-off and Shiba Inu was no exception to the broader trend. At press time, the dog-themed coin fell by 5.6% and broke below a bearish pattern on the 4-hour chart. Here’s what the breakdown means for SHIB.
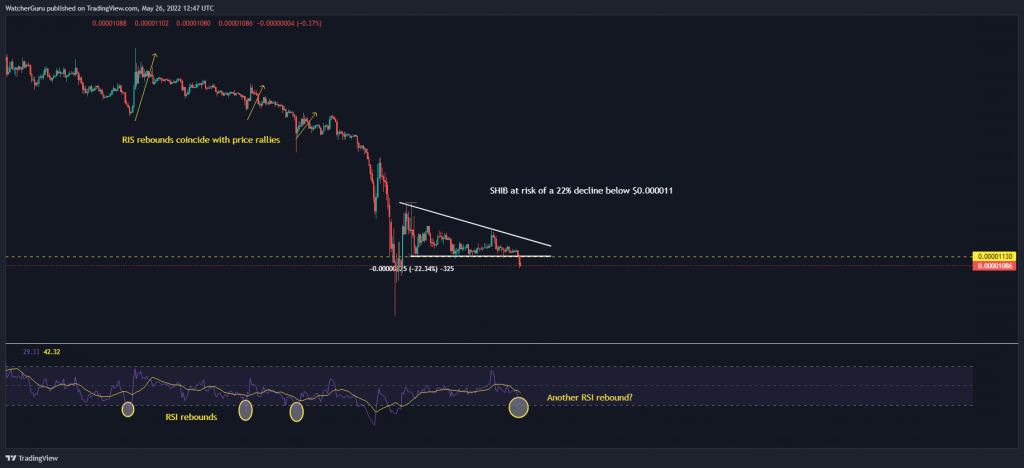
Following Thursday’s retracement, Shiba Inu’s price pierced below the lower trendline of a descending triangle setup – the development often suggests that the market would continue to slide further in the coming sessions. Based on the height of the pattern, SHIB was vulnerable to a further 22% decline.
Now, it’s not uncommon for prices to head back within the pattern after a breakdown. In technical analysis, the same is referred to as a ‘false breakout’. These kinds of ‘fakeouts’ generally take place when there is not enough sell pressure to drive the prices lower. They could also signal traders to enter a trade in the opposite direction, capitalizing on weak market momentum.
Looking at SHIB’s technicals, there was some evidence to suggest that the decline would not be as drastic as projected by its bearish pattern.
Firstly, the 4-hour RSI (see chart above) had tagged the oversold region for the first time in two weeks. Barring 12 May’s sell-off, which was triggered by the LUNA-UST collapse, SHIB’s price has been known to rebound almost every time the RSI drops below 30.
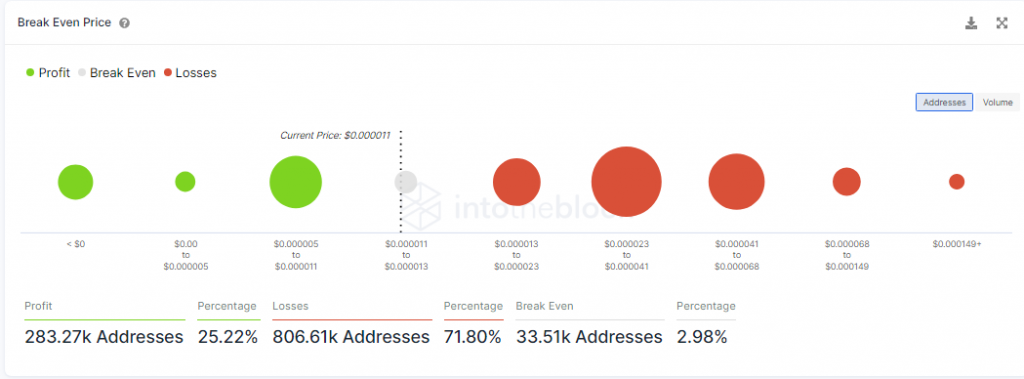
Meanwhile, as per IntoTheBlock, over 800K addresses were making a loss below $0.000013. The general notion was that the bulk of these addresses would not participate in the current sell-off in order to avoid taking a loss on their investments. Instead, it was expected that these holders would stay put and HODL their tokens, awaiting a break-even point.
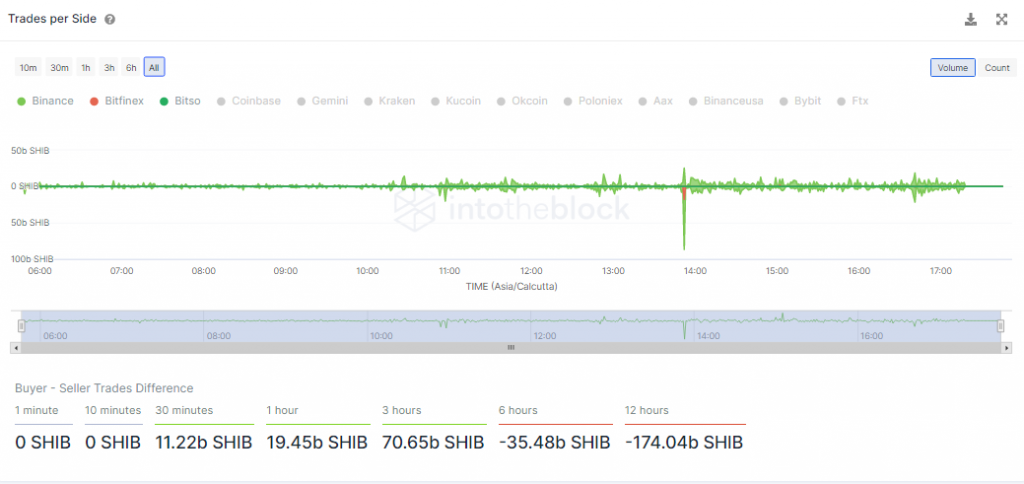
Interestingly enough, SHIB’s order book indicated that buyers were beginning to challenge the decline. While sellers still maintained the majority, buy orders were picking up on exchanges over the past few hours.
Shiba Inu 4-hour Chart
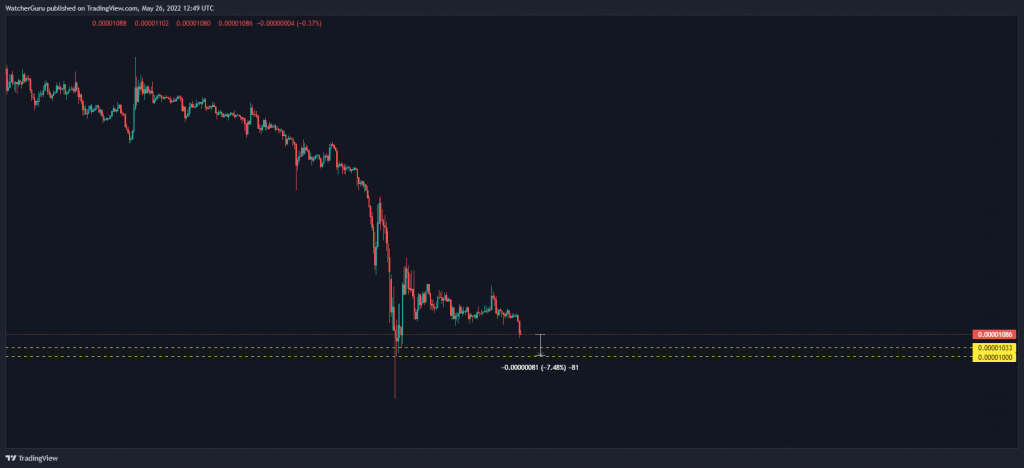
In an earlier article, SHIB’s max pain threshold was described around the $0.00000870-level, and looking at a descending triangle breakdown, investors might be worried about a severely bearish outcome.
However, judging by its technicals and exchange volumes, SHIB could avoid a crash to $0.00000860. Instead, near-term supports of $0.00001050 and $0.0000 might be able to ward off sell pressure and limit SHIB’s losses to just another 4%-7%.