


Shiba Inu’s price has become awfully quiet recently as investors remain cautious about the macro trends in the crypto market. Unless Bitcoin clears a major level this week, SHIB could see minimal price movement and might even be forced to take some losses if the price closes below its near-term defense.
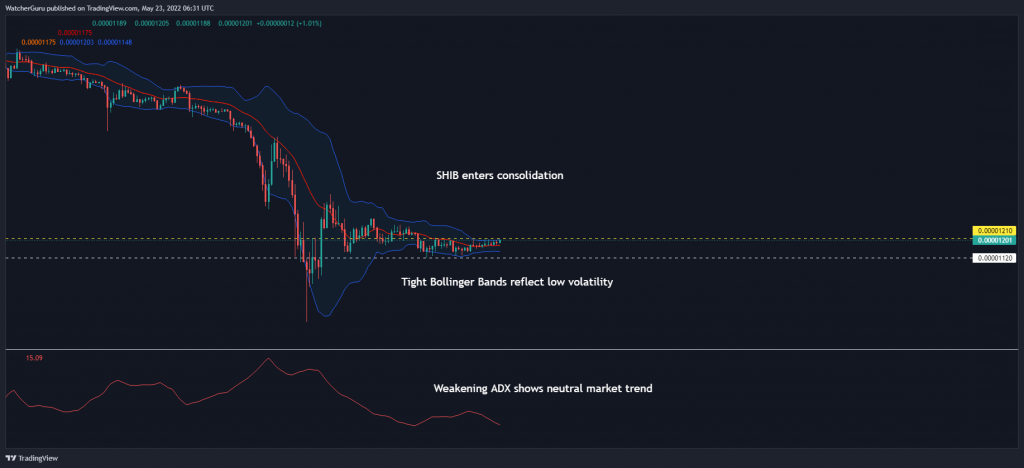
Shiba Inu’s price has consolidated between $0.00001210-$0.00001120 over the last five days, reflecting a period of uncertainty in the market as buyers and sellers battle for market control. The trend is likely to be a recurring theme this week judging by the 4-hour metrics.
According to the Bollinger Bands, Shiba Inu had entered a period of low price volatility following a turbulent first couple of weeks of May. The tight nature of the bands suggested that investors were unlikely to observe wild price swings over the short term.
The Average Directional Index also presented a similar tone. The index has weakened gradually and was now parked below 15. Any reading below 25 indicates a lack of momentum between buyers and sellers.
Whale and large holders absent?
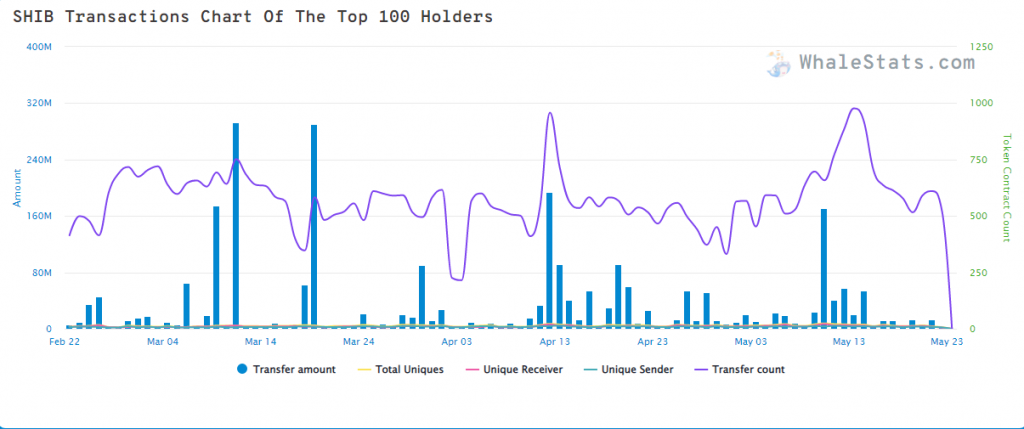
With Shiba Inu settling within a range and offering a discounted price, one would expect some whale purchases to come through. However, that has not been the case thus far. A downtrend along the token transaction count indicated that top Ethereum whales were limiting their interaction with SHIB instead of making collective purchases.
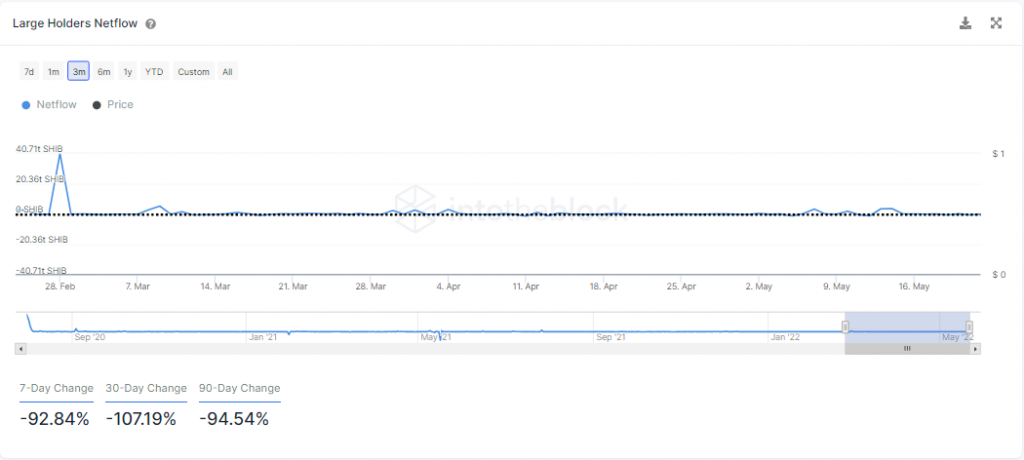
Other large holders and whales often maintain a similar market outlook and it was not surprising to see that the former group was also skeptical of SHIB’s trend. The large holders NetFlow dropped by 93% over the week as addresses holding over 0.1% of SHIB’s circulating supply were still engaging in selling activity.
Shiba Inu 4-hour Chart
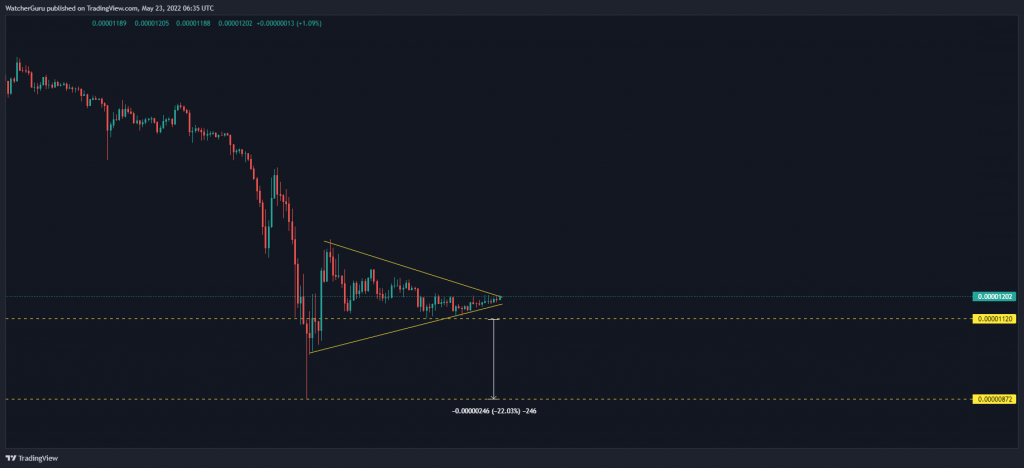
Periods of low volatility will always be followed by periods of high volatility and with a symmetrical triangle pattern visible on the 4-hour chart, a breakout was expected over the mid-long term.
Without an accumulation trend, the breakout was likely to favor the sell-side. If the price does close below $0.00001120 support, investors can expect a 22% retracement to $0.00000870 based on the height of the pattern.
To flip this outlook, SHIB had to register a 4-hour close of the upper Bollinger Band at around $0.00001210. In either case, it was unlikely gains would carry forward beyond $0.00001310 unless there is support from a bullish Bitcoin.