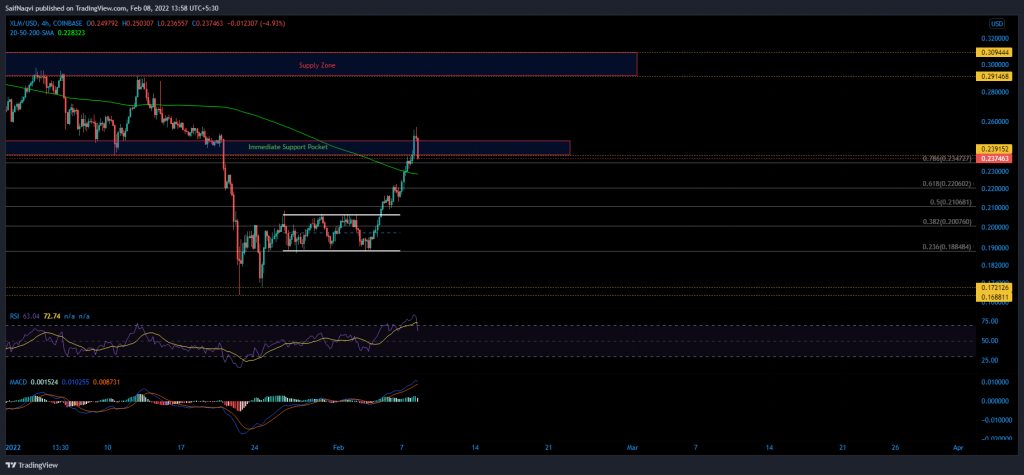
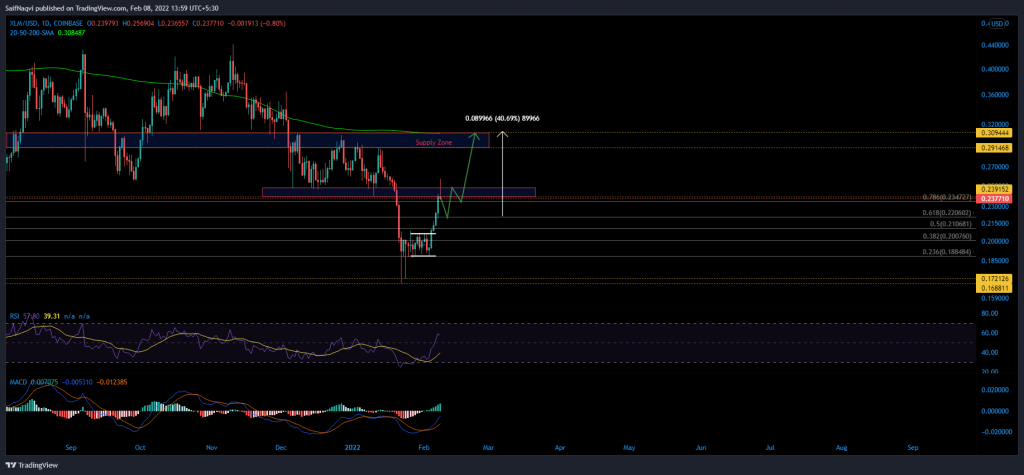
Stellar Lumens’ rally was easing on the 4-hour time frame after completing a full 36% run-up from $0.189-$0.257. An early rebound above the 61.8% Fibonacci would set the alt on course to a 40% ascent over the coming week. The bullish outlook would be invalidated in case of a close below $0.206.
Stellar Lumens 4-hour time frame


XLM’s price broke out on a horizontal channel and set up an additional 23% jump from the upper trendline. The price had now completed a full U-turn of a 33% sell-off during January’s flash crash. Having said that, XLM was amidst a correction on the lesser timeframe. The developing red candles were driven by an overbought 4-hour RSI, which warranted stabilization. Fortunately, XLM had a plethora of support zones at its disposal.
A demand area between $0.40-$0.48 could activate an immediate rebound, while the 61.8% and 50% Fibonacci levels (XLM’s decline from $0.253-$0.168) harbored the 200-SMA (green) and cushioned against a deeper sell-off.
XLM Daily Time Frame


It’s worth noting that XLM was increasingly bullish on the daily timeframe and its rally looked set to continue once the above-mentioned retracement plays out. The daily RSI floated at 60 and presented no tailwinds until 75, while the daily MACD witnessed its first clear bullish crossover in 40 days.
The next logical target lay within a supply zone of $0.291-$0.305, representing a 40% hike from $0.220 to the upper limit. However, an extension above the daily 200-SMA (green) would likely require an external catalyst.
Meanwhile, Bitcoin’s correction could be around the corner and a move below $40K would weigh on the altcoin market. Hence, a move below $0.210 cannot be discounted. In such a case, XLM would call upon its defenses at $0.188-$0.1688.
Conclusion
Once a near-term correction is done and dusted, XLM’s value was expected to touch $0.189-$0.257. The favorable outlook was backed by green signals on the daily MACD and RSI.


