


Crypto space is very volatile. Besides, there are several coins in this space that behave differently pending different community factors. Venturing into cryptocurrency is not a business for the faint-hearted. In most cases, it’s like a gamble. There are several cryptocurrencies, but we will discuss the Top Five Crypto that deserve much attention.
Top Five Crypto to Look out for
Crypto 1: BTC/USDT
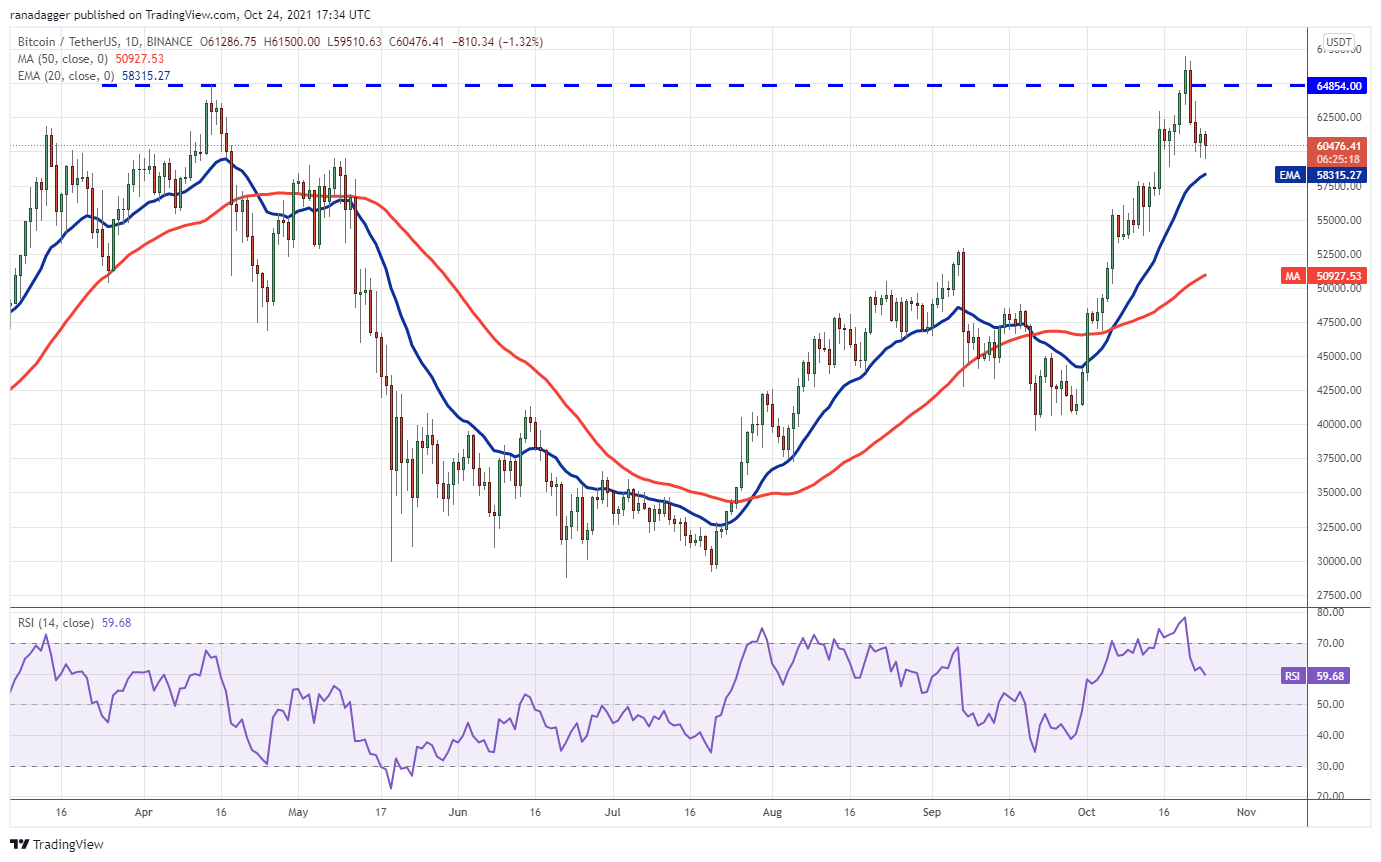
Bitcoin hasn’t been doing well lately and has faced a strong rejection in the $64,854 to $67000 zone. The price could drop lower with resistance at a 20-day exponential moving average ($58315). However, if it bounces off this level, traders will most likely buy on dips as sentiment remains positive despite some fluctuations over the last few sessions.
Source: TradingView
The bulls will then make one more attempt to push the price above the overhead zone. If they can pull it off, the BTC/USDT pair may resume its uptrend. The pair could then rally to its target objective at $84,533.12.
The upsloping moving averages and the relative strength index (RSI) in the positive zone indicate that buyers have the upper hand.
Contrary to this assumption, if the price turns down and breaks below the 20-day EMA, it will suggest that the break above $64,854 may have been a bull trap. The pair could then continue its slide to the 50-day simple moving average ($50,927).

Source: TradingView
The pair is currently correcting inside a descending channel. The immediate support level at $58,739.17 could be an important one for the bulls to defend because if it cracks, then selling pressure might increase, which may lead them into some bad times overall with potential downside risks of more than 15%.
The 20EMA has turned down, which suggests that bears are in control. A break above the channel and moving averages will invalidate this negative view. However, if it happens, expect a retest of last week’s high, the overhead zone.
SOL/USDT
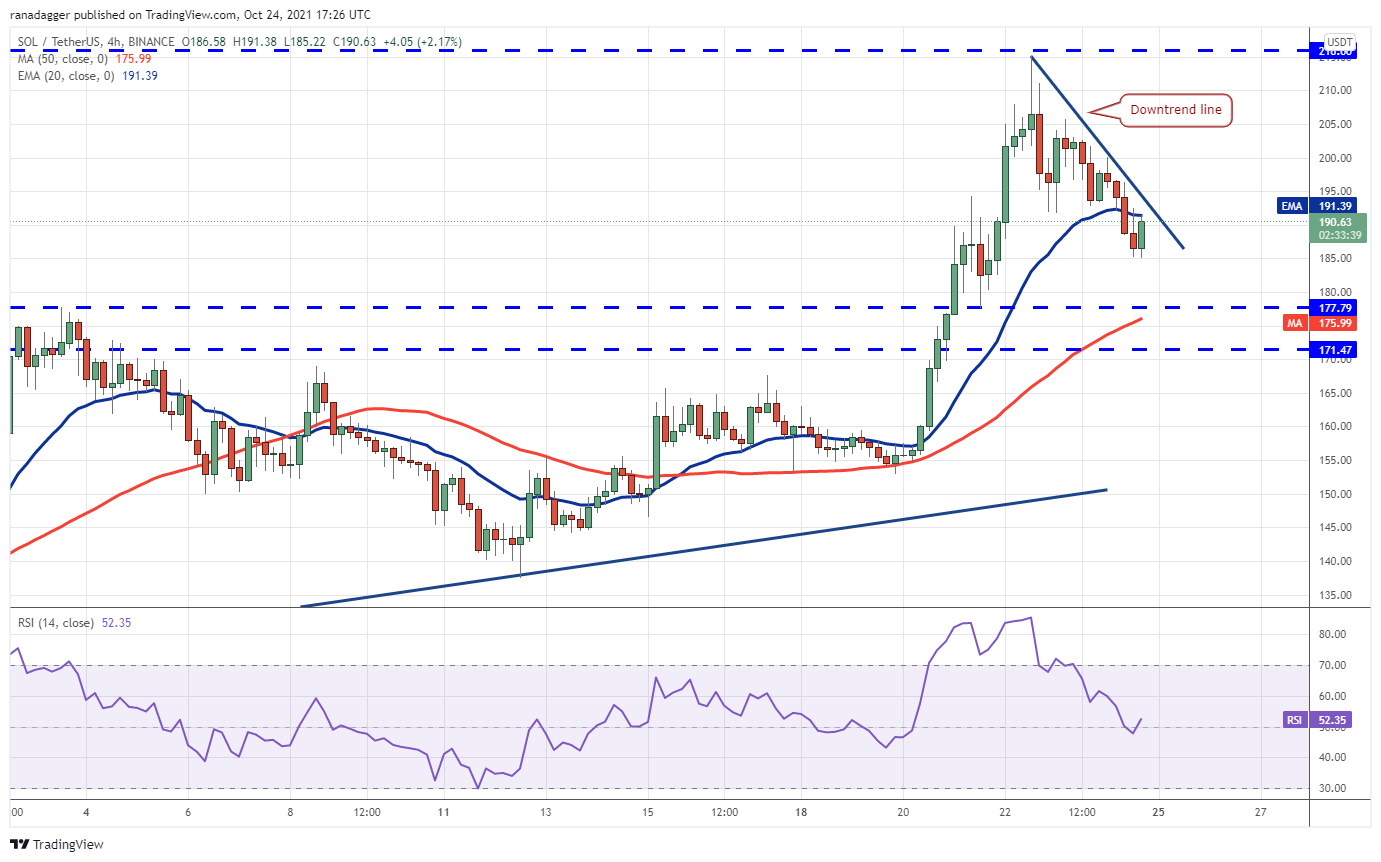
On Saturday, Solana’s (SOL) long wick on a downtrend suggests bearish activity at $216. Now, the altcoin formed an inside-day candlestick pattern that day to indicate indecision among traders of both sides in this fight for control over prices.

Source: TradingView
This uncertainty resolved to the downside today, and the price could drop to the breakout level at $177.79. If the price rebounds off this level, it will suggest that sentiment remains bullish and traders are buying on dips.
The bulls will then again try to drive the price above $216. If they succeed, the SOL/USDT pair could rise to $239.83. The marginally rising 20-day EMA ($168) and the RSI in the positive territory indicate an advantage to buyers.
A fall in price will negate this positive view and break below the 20-day EMA. That could pull the price down to the trendline of the triangle.
Source: TradingView
The bears are in control of the price action, and they’ve pulled it below $200. If sellers sustain this level for long enough, we could see some weakness down to around $177, which may be an excellent buying opportunity.
A break and close above the downtrend line will be a sure sign that traders are buying on dips. If this resistance is crossed, it may suggest that prices have hit their floor from previous declines – which would lead up to a new all-time high.
AVAX/USDT
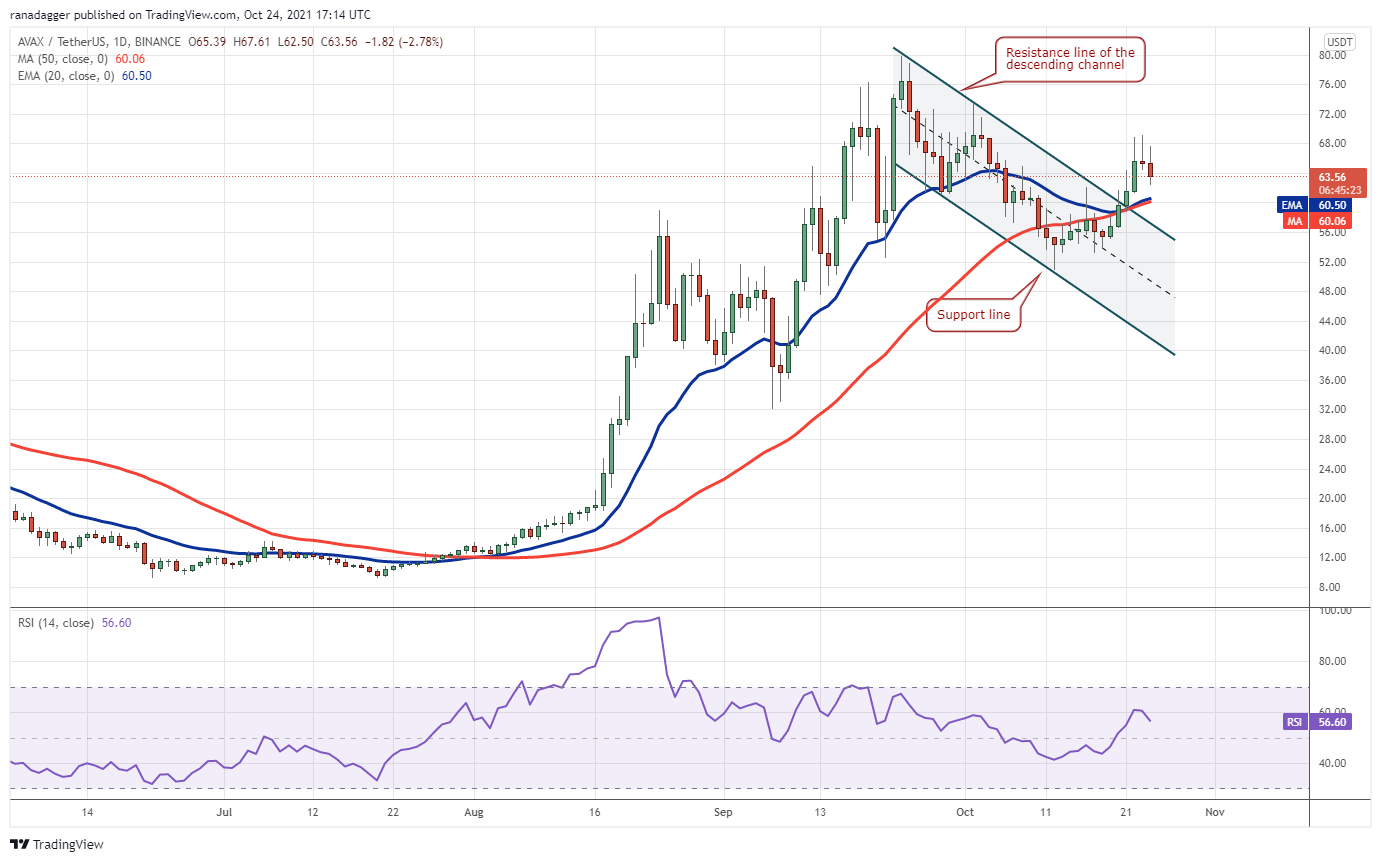
After breaking and closing above the descending channel on Oct 21, the charting pattern suggests that Avalanche (AVAX) completes a bull market run. This could mean the correction may be over, with prices poised for an upward trend now.
Source: TradingView
The long wick on the Oct. 22 and 23 candlestick suggests that demand dries up at higher levels. The AVAX/USDT pair could decline to the moving averages.
A strong rebound off this support will suggest that traders continue to buy on dips. The bulls have one more opportunity to resume the up-move by pushing prices above $69. And if they succeed, then we could see a rally towards $73 which will be an all-time high.
But, if the price breaks below the moving averages, the pair could drop to the strong support at $51.04. If this level also gives way, the next stop could be the support line of the channel.
Source: TradingView
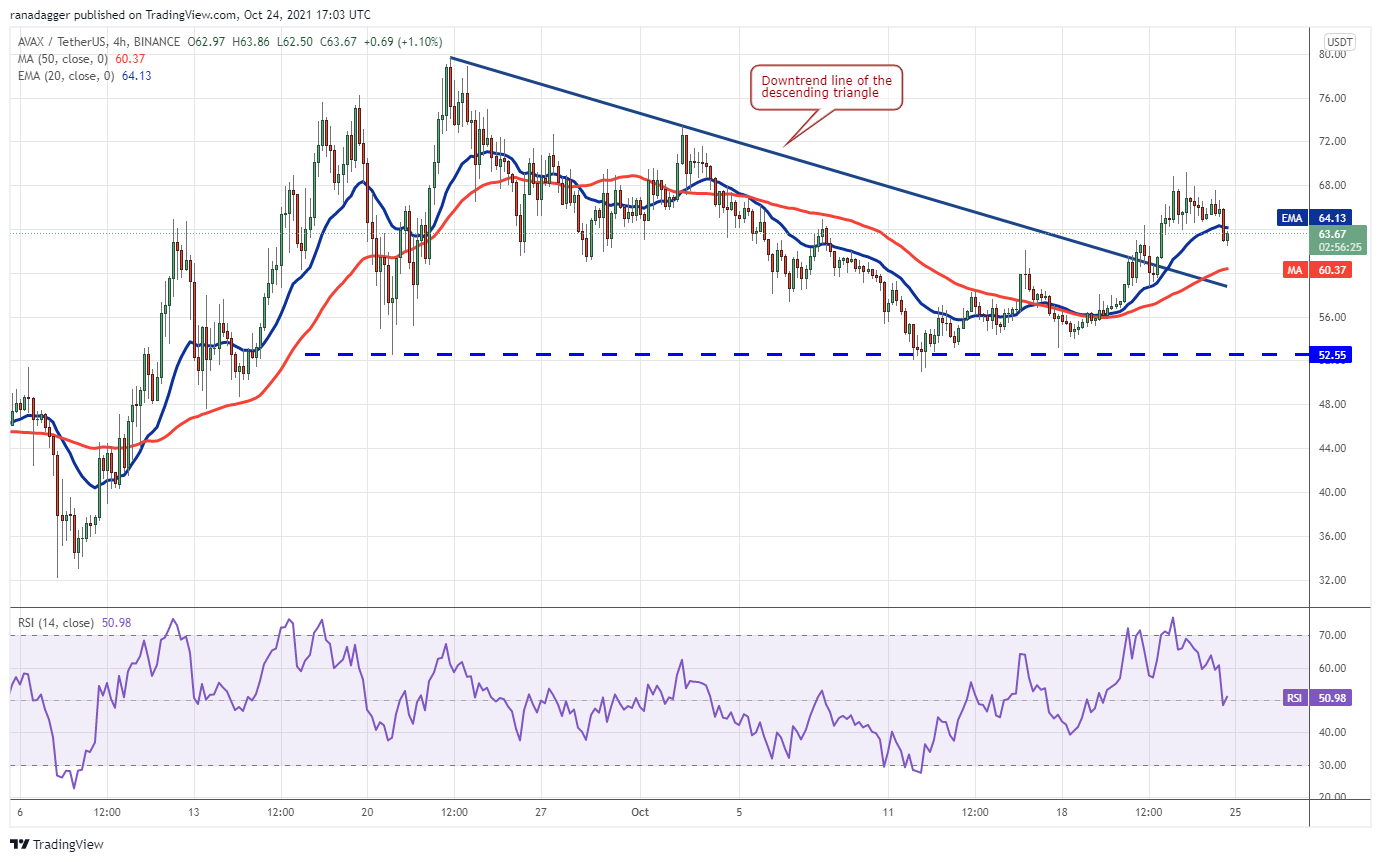
A triangle is a widely used trading pattern that consists of three trend lines. The bulls pushed the price past two upward-pointing angles, which invalidated their bearish setup. Yet, it didn’t last long because bears pulled back below 20-EMA again to suggest selling at higher levels.
The pair could now drop to the 50-SMA. If this support is breached, the bears will try to pull the price back into the triangle. If that happens, it will suggest that the breakout above the triangle was a bull trap.
Otherwise, Bulls have the upper hand on a breakout of $69.18 as resistance, and they will try to propel prices up towards their all-time high.
ALGO/USDT
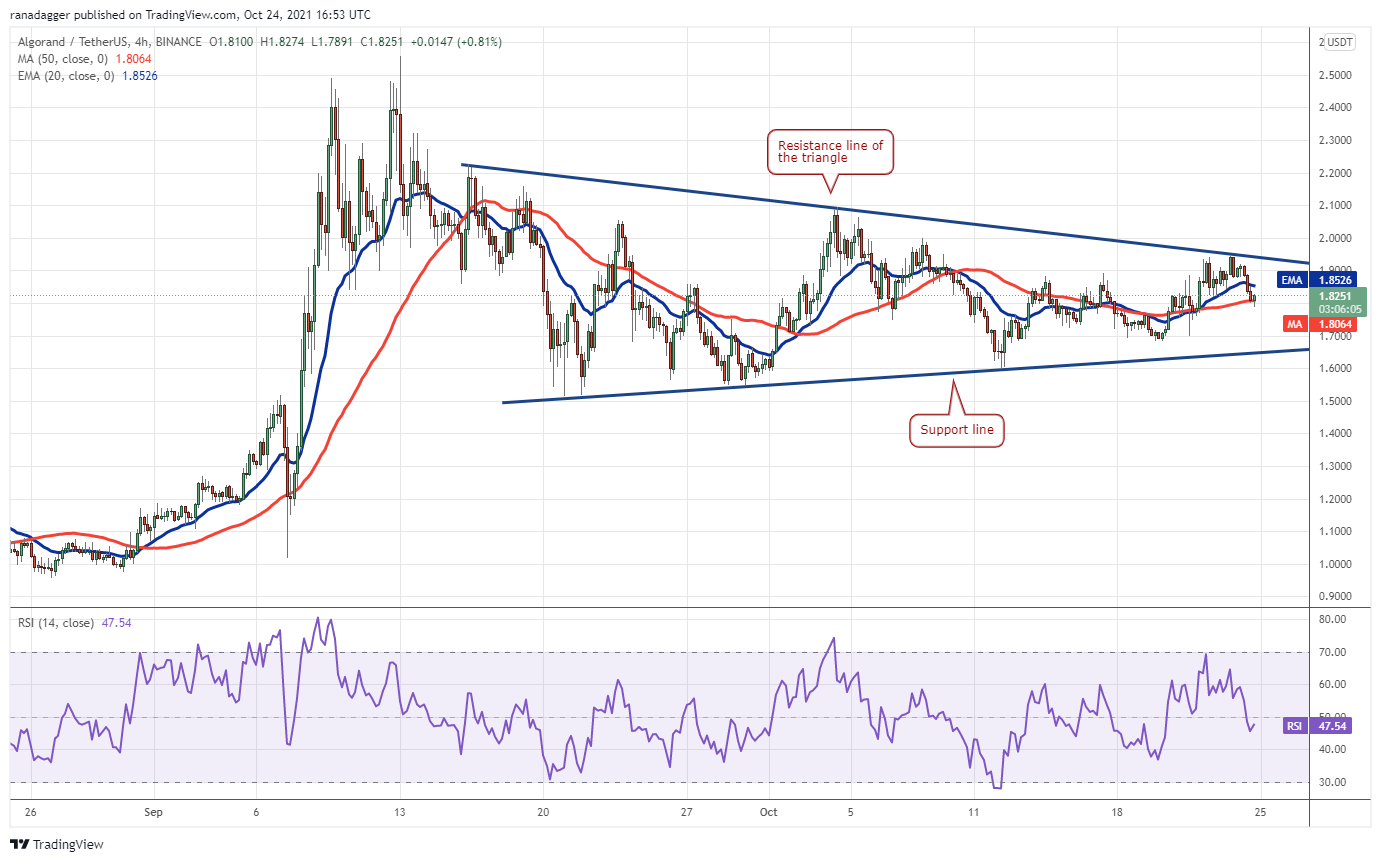
Algorand (ALGO) has been trading on balance for the past few days. The price went down from the resistance line today. An indication that bears isn’t about to let bulls take over.

Source: TradingView
If the price dips below the moving averages, the ALGO/USDT pair could drop to the triangle’s support line. This is an important level for the bulls to defend because if it cracks. The bears will try to pull the price to $1.51 and then to $1.20.
Alternatively, if the price turns up from the current level or the support line and breaks above the triangle, it will suggest that bulls are in control. The pair could then rally to $2.22 and later retest the all-time high at $2.55.
Source: TradingView
The price is getting squeezed inside the triangle, indicating that a strong directional move may be on the offing. The crisscrossing moving averages and RSI near midpoint do not provide clear clues as to who will come out ahead in this battle between bulls or bears.
A break above the triangle will suggest that bulls have absorbed selling and could resize up move. Conversely, a Break below suggests demand exceeds supply which may result in a deeper correction.
AXS/USDT
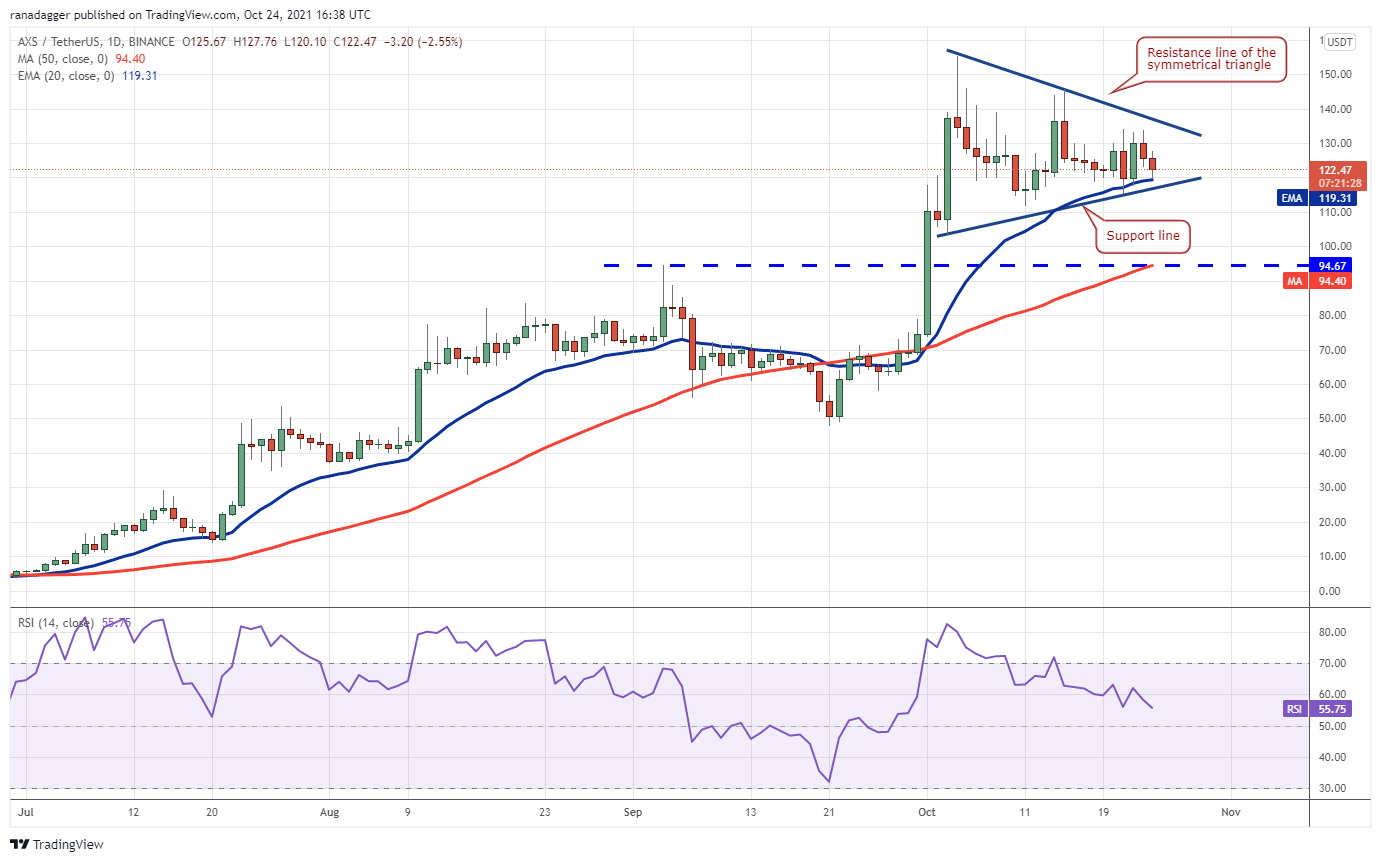
Axie Infinity (AXS) is in an interesting position about both bears and bulls. The symmetrical triangle pattern indicates indecision. But it’ll be difficult for either side to come out ahead.
Source: TradingView
The price will either rebound off the support line and signal a resumption of an uptrend. If it succeeds in pushing through, then we may see another attempt at reaching $155 again. This would make for a possible all-time high.
The bullish momentum could pick up if buyers clear this overhead hurdle. The pair may then rally toward the pattern target at $186.05.
The market is volatile. The first correction sign will be when it falls below $103 and then to its breakout level at 94$. But it’s important not to get too excited about this because corrections are normal in any trading environment.
Source: TradingView
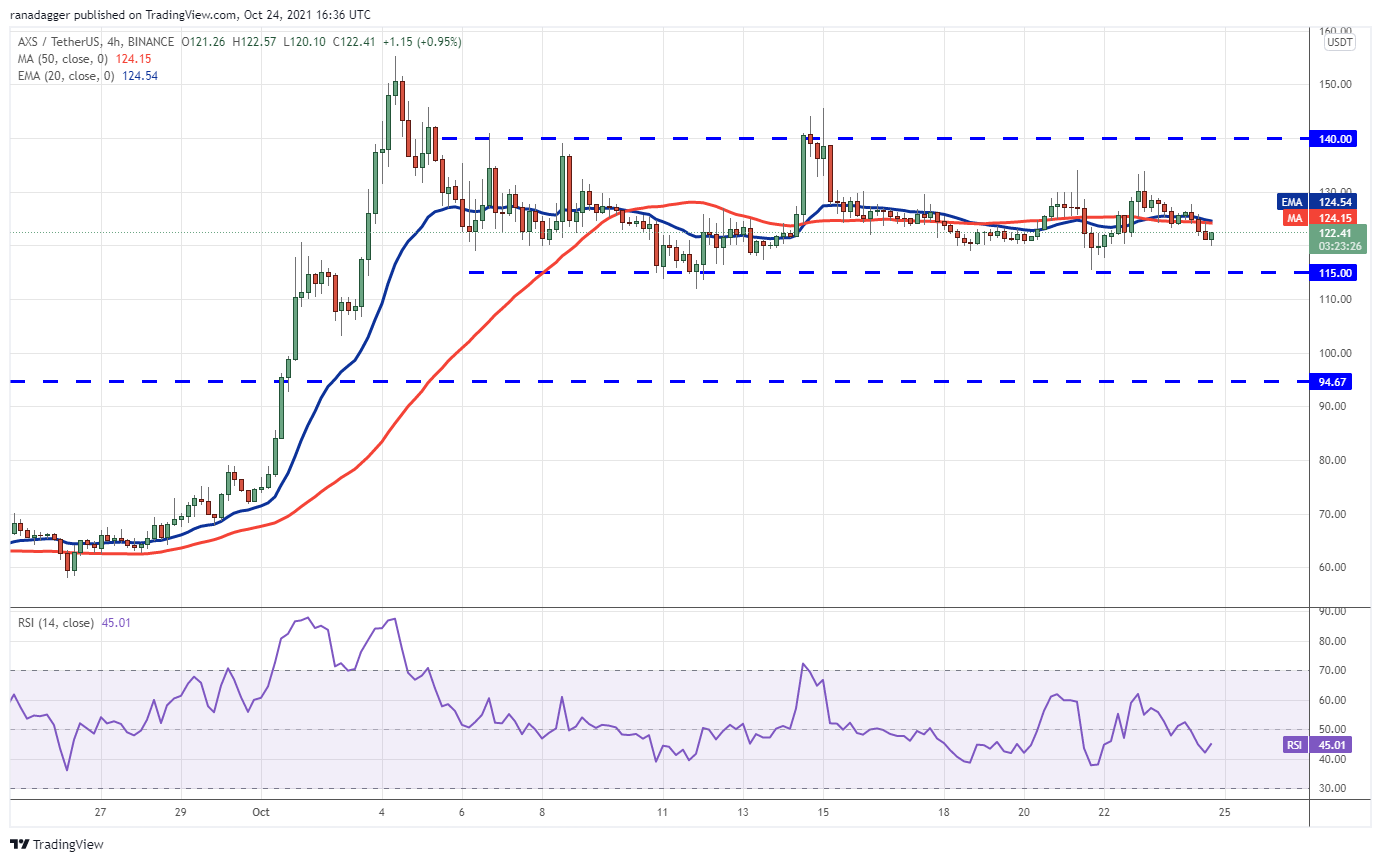
The market has been trading in a state of equilibrium, with traders buying and selling near $140. The moving averages have flattened out on the 4-hour chart, but this does not suggest an impending trend change. The RSI indicator oscillates between 40 to 62 overtime which could also indicate some balance.
A break and close below $115 could signal that the uncertainty has resolved to the downside. That could pull prices down towards 90, but we might see some trading between 140-165 instead on an upside surprise from bears.