


Bitcoin has dropped by 8% over the past 48-hours, causing a massive decline below $60,000. Bearish speculations are rising in the market as the collective industry has been gripped by bearish momentum. However, there might be a recovery taking place for Bitcoin at press time. Bitcoin registered a trading volume of $41 billion, with a weekly decline of 9.7%.
Bitcoin 1-hour and 4-hour time frame analysis
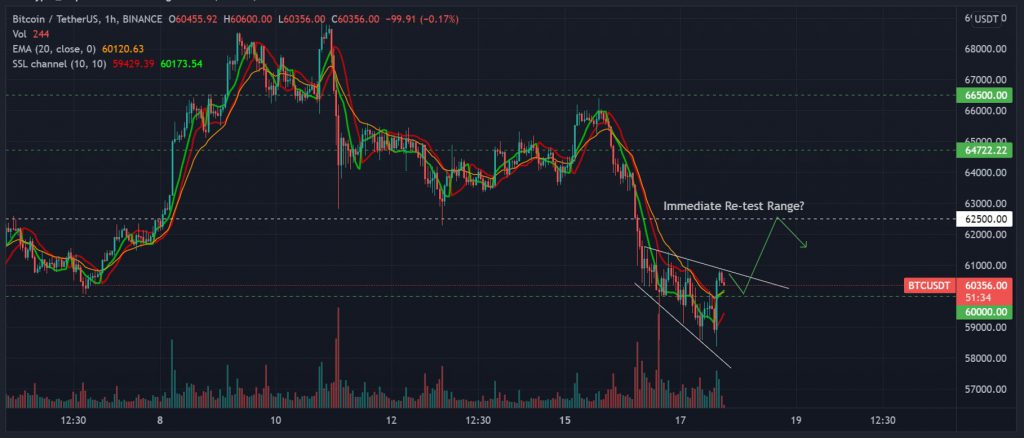
In order to carry forward a constructive short-term analysis, we are evaluating both the 1-hour and 4-hour time for Bitcoin. Bitcoin collapsed below key levels within the last 24-hours and reached a low of $58,300 in the charts. However, in the same hourly low candle, BTC managed to demonstrate an active recovery above $60,000. This is the first sign of bullish momentum over the past two days.
On the hourly time frame, Bitcoin established a position above the 20-period Exponential Moving Average for the 1st time since 15th November. The SSL indicator also turned green in the charts. SSL or Semaphore Signal identifies changing price and trend dynamics and whenever the green line has an advantage, it suggests trend reversals.
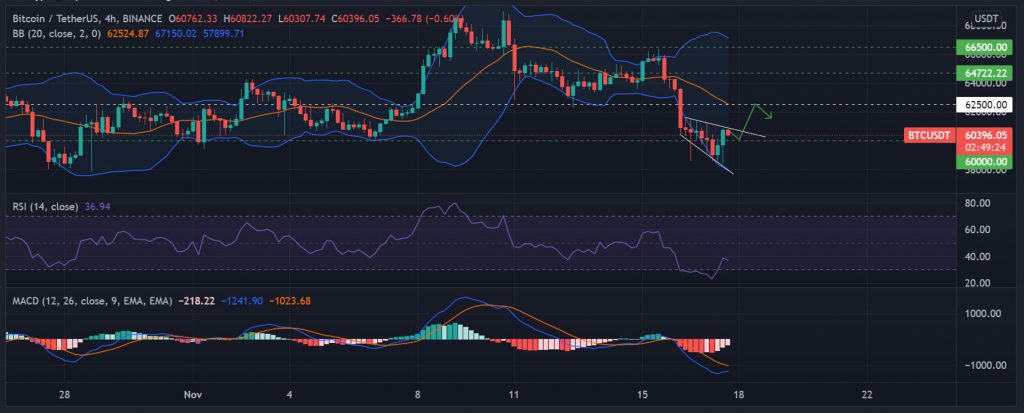
Now, analyzing BTC’s 4-hour chart, similar bullish signals can be identified. While the asset continues to move between the broadening wedge pattern, a bullish breakout can be assisted by rising buying pressure. Relative Strength Index or RSI registered a re-test at the oversold region. Therefore, selling pressure should decrease in the short term for Bitcoin.
MACD remained bearish in the chart but a reversal is expected.
How to trade Bitcoin right now
Bitcoin should be able to re-test $62,500 over the next few days at a recovery bounce. However, the long-term trend is turning strongly bearish hence after a re-test it might drop below $60,000 again.