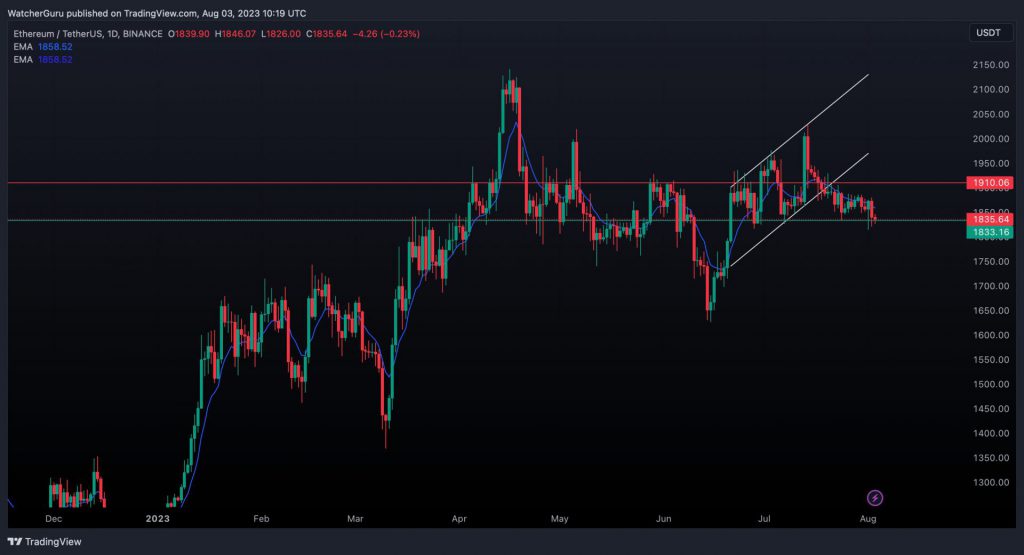
Ethereum (ETH), the second-largest crypto by market cap, has been on a downward trend since July 14. It should be noted that ETH has constantly seen higher highs and higher lows throughout this year. However, that trend was recently broken when the XRP-ruling rally did not take the coin over its previous high of $2120, attained on 16 April. ETH went a little over the $2k level before dwindling back down.
However, the lower high is not the only bearish pattern around Ethereum (ETH). The asset has also broken an ascending channel and it is not showing any signs of recovery. ETH is currently facing resistance at around $1910, with support at around $1833.


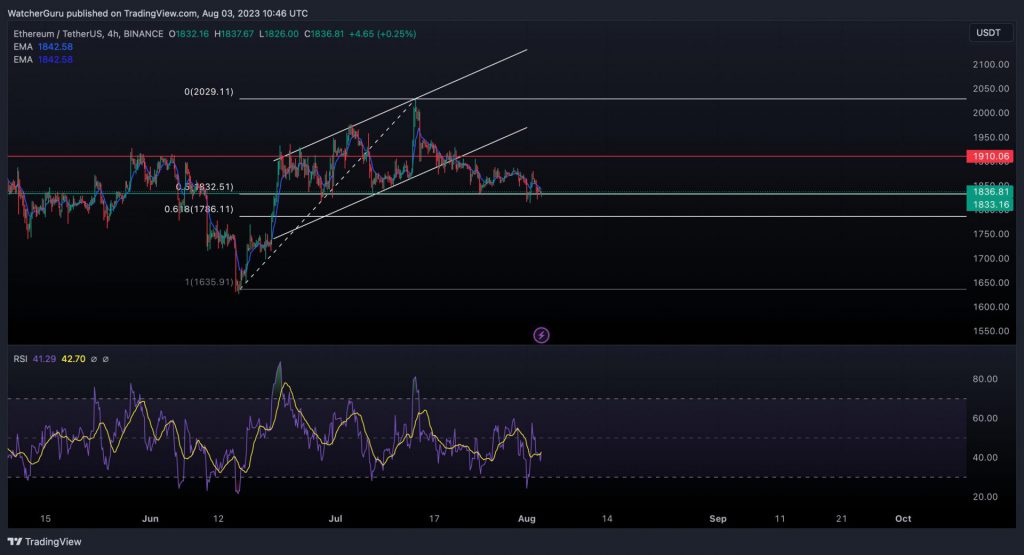
On the other hand, ETH’s price seems to be consolidating at the moment, albeit after registering a lower high, which again points to a bearish development. RSI (relative strength index) currently stands at 42.74, further confirming the consolidation.
Also Read: Ethereum: These ETH Futures ETFs Are Awaiting Approval
ETH’s current slump could be attributed to larger macroeconomic developments. The U.S. Federal Reserve recently raised interest rates by 25 basis points. Additionally, the U.S. private sector jobs data registered more jobs than anticipated. The job data could give a reason to the Fed to increase interest rates again later this year, adding to investor caution.
How far could Ethereum fall?
Looking at ETH’s Fibonacci retracement level, the asset’s price could fall to around $1800. ETH’s price has already touched the 0.5 fib level, hence we could see a trend reversal soon. However, given that there are more bearish signs than bullish ones, this might not come to fruition.


Also Read: Shiba Inu More Popular Than Ethereum, Dogecoin in the U.S.
If ETH falls below $1786, the asset’s price faces a risk of falling to its previous support of $1720. At press time, Ethereum (ETH) was trading at $1,835.97, down by 1.1% in the last 24 hours.


