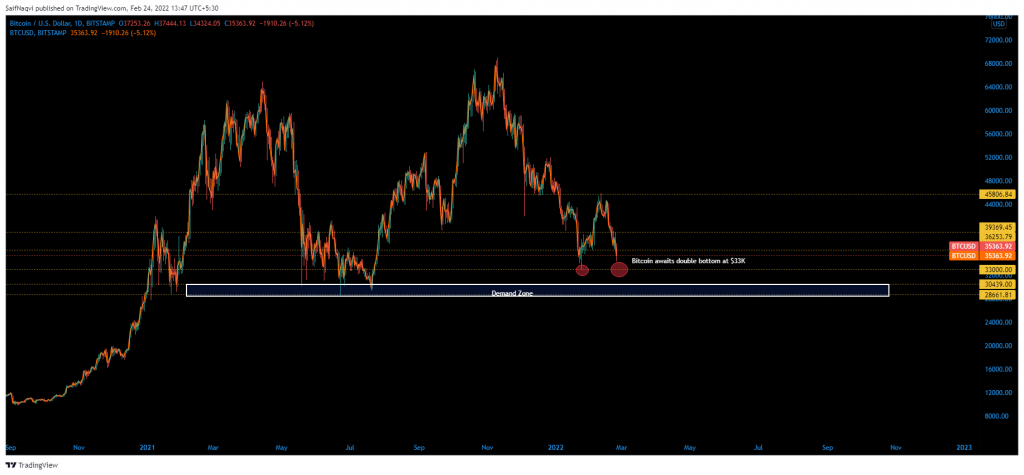
A global market rout gripped the financial landscape all across the world following Russia’s invasion of Ukraine. The world’s largest digital asset, Bitcoin, was in a precarious situation below $34K. The domino effect across other altcoins was immediate, with the total crypto market cap down by nearly 10% to $1.59 Trillion over the last 24 hours alone.
A quick round-up of the major stock indices presented the situation at hand. Wall Street’s S&P 500 hit weekly lows after declining by 1.84%, Europe’s Euro STOXX diminished by 3.48%, whereas Russia’s MOEX slid by a drastic 44%.
Bitcoin’s correlation with the SPX sat at its highest ever level on 22 February to make matters worse. The digital asset’s foray into traditional financial markets through spot trading, derivatives, and ETFs have changed the way investors approach the so-called ‘risky assets’ such as Bitcoin. Generally speaking, investors pull out of Bitcoin when global stock markets do not perform well as investors tend to take fewer risks with digital assets in such periods.
What Are Analysts Saying?
As the global turmoil continues, analysts are taking bearish positions against the major Wall Street indices.
Futures tracking the Nasdaq 100 Index showed that U.S. equities are gearing for a bear market for the first time since March 2020 as risk apatite turned sour amidst geopolitical tensions. The Wall Street Journal reported that short sellers are adding to their positions against the SPDR S&P 500 Exchange-Traded Fund Trust, which tracks the broad U.S. stock index, at the fastest rate in nearly a year.
All of the abovementioned factors suggested that Bitcoin may continue to face headwinds over the short term as well.
Where Does That Leave Bitcoin?
Now that Bitcoin’s correlation with global markets was established, the question that remained was – how low can Bitcoin go? Will we see a comeback above $33K or is the market headed to $28K-$30K?


The charts pointed out that BTC’s defense at $33K was its next logical point of contact. The area was discovered during a reliable defense during the late-January flash crash. Furthermore, a double bottom pattern would also be active close to this level. In technical analysis, a double bottom is a bullish reversal pattern that can trigger buying behavior. If BTC does close below $33K, a demand zone between $30K-28K would be its next destination.


The total crypto market cap was strikingly similar to BTC’s chart. Post the latest decline, the total crypto market cap had slipped to $1.57 Trillion. A double bottom setup was available at $1.49 Trillion which meant that the near-term drop was likely to continue by a few more points before the bullish pattern comes into the picture.
Conclusion
A host of factors pointed to a restrained global outlook over the next few days. Bitcoin’s near-term drop was expected to continue until its price tests the all-important $33K region. With a double bottom available on both the BTC and total crypto market cap’s chart, Bitcoin could cut its losses above $33K and avoid a return to sub $30K levels.


